Window Patterns: Setup Essentials for Trades
Window patterns are gaps between the full ranges of two adjacent candles. A rising window leaves the second candle’s low above the first candle’s high; a falling window leaves its high below the first candle’s low. Traders examine these formations for trend continuation, potential support or resistance, and signs that an earnings release or other event has repriced the market.
LuxAlgo’s charting and AI platform helps turn that observation into a repeatable process. Use Quant Charts to inspect the gap and surrounding trend, then work with Quant, our coding agent, to define and research the rules. A visible window is a starting point for analysis, not a guaranteed trade.
Why They Matter
- Trend context: a gap out of consolidation differs from one late in an extended move.
- Risk planning: window edges provide reference levels, but stops can slip through them.
- Volume context: unusual activity can support a hypothesis without proving continuation.
- Precise definitions: a close-to-open gap is not necessarily a full-range window.
How to Trade Them
- Wait for the second candle to close and confirm that the two full ranges do not overlap.
- Record the trend, session, event context and gap boundaries.
- Apply a stated entry rule, such as a later break beyond the signal candle or a defined retest.
- Choose invalidation and target levels, calculate position size, and account for costs and gap risk.
Window Pattern Types
Rising Windows
For adjacent completed candles 1 and 2, a rising window requires low₂ > high₁. Its empty price interval lies between high₁ and low₂. In the conventional continuation interpretation, the preceding trend is upward. The same gap geometry in a different context does not automatically establish that trend.
Falling Windows
A falling window requires high₂ < low₁, leaving an interval between high₂ and low₁. Its conventional continuation context is a downtrend. Candle-body colors alone do not determine either pattern; the wicks must also remain separated.
| Pattern | Full-range condition | Reference zone | Failure to consider |
|---|---|---|---|
| Rising window | Second low above previous high. | Potential support between the two boundaries. | Price may return into or completely fill the gap. |
| Falling window | Second high below previous low. | Potential resistance between the two boundaries. | Price may rebound into or above the gap. |
| Close-to-open gap | New open differs from previous close. | Session reference prices. | Candle ranges can overlap, so this need not be a window. |
If the extremes merely touch, the strict rule does not identify an empty interval. A gap visible early in a session can disappear before its candle closes. Keep the symbol, feed, session and adjustment settings consistent: changing regular versus extended hours can change what appears to be a gap.
Pattern Elements and Historical Statistics
Study the gap’s size, preceding trend, nearby levels and later price behavior. Common, breakaway, continuation and exhaustion gaps describe different contexts; an exhaustion label often becomes clear only after subsequent movement. Do not assign that future knowledge to the original signal.
Thomas Bulkowski’s rising-window research reports bullish continuation in 75% of its tested cases. That is a historical pattern statistic under the author’s methodology, not a 75% profitable-trade rate for an arbitrary entry, stop and target. The same page reports an average of 79 days and median of 11 days until gap closure. These describe the time taken to retrace the gap, not a recommended holding period or a deadline by which a new gap must fill.
Frequency claims also require a defined sample. The earlier figures of 36,612 occurrences and 2,236,421 candles would imply about 1.64% of candles, not 5.73%. Without a verified matching denominator and methodology, they should not be used to estimate how frequently this setup will occur in your market.
Pattern Recognition Methods
Pattern Detection Steps
| Step | Action | Check |
|---|---|---|
| Chart setup | Use ordinary candles on a specified session and timeframe. | Avoid mixing feeds or synthetic candle definitions. |
| Trend analysis | Mark confirmed swings or use a predefined moving-average condition. | The trend rule must be known when the signal closes. |
| Gap identification | Compare adjacent highs and lows. | Separate full-range windows from body gaps and three-candle FVGs. |
| Volume analysis | Compare with a stated baseline, such as the prior 20 completed sessions. | Use comparable sessions and the same volume source. |
| Confirmation | Specify a later close, breakout or retest condition. | Record its timing and setup expiry before testing. |
Detection Software
The LuxAlgo Imbalance Detector distinguishes opening gaps, fair value gaps and volume imbalances. Its opening-gap rule compares adjacent candle extremes, which matches the window geometry discussed here. Minimum-width settings can filter zones by points, percentages or ATR multiples. A preceding-trend condition remains a separate part of your window strategy.
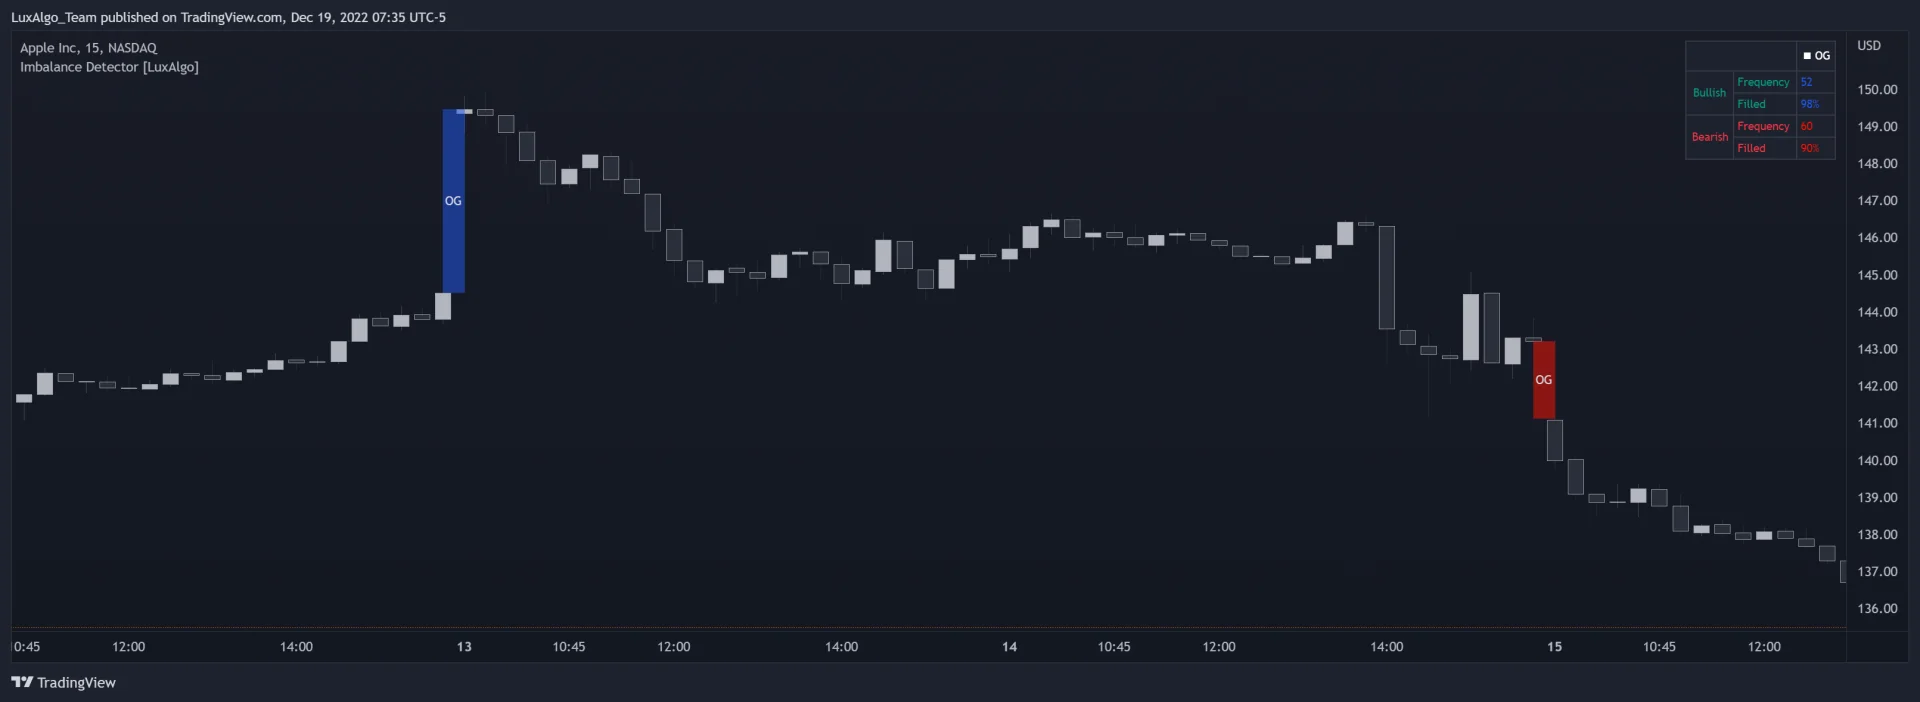
The Library offers an Open on Quant Charts workflow. The original TradingView publication documents its imbalance alerts and dashboard; check the implementation and settings on the platform you use. A fill percentage is sensitive to the sample and definition of a fill. It is not a forecast or a strategy return.
Volume Analysis
Above-average volume means greater activity relative to the chosen baseline. A spike around earnings may accompany continuation, reversal or a gap that fills quickly. Low volume may reflect a thin session rather than a weak version of the same setup. Test volume as an explicit condition instead of describing it as proof.
On intraday charts, compare like-for-like times when possible because opening volume often differs from midday volume. In Quant Charts, market-data coverage matters: U.S. equity volume from Cboe EDGX is exchange-specific rather than consolidated market volume. Do not compare it directly with a different feed’s totals.
Trading With Window Patterns
Trade Entry and Exit
Confirm the window first, then choose a trigger. Buying immediately after confirmation, buying a later break above the signal candle, and buying a retest of the gap edge are distinct strategies. They create different entry prices, missed trades and risk distances. Apply the corresponding logic to shorts without assuming that bearish and bullish results are symmetrical.
Fibonacci levels from the Library can provide additional reference levels when the swing anchors are specified. A 23.6% or 38.2% retracement is not automatically the correct window target or entry. Record the swing high and low used, the retracement direction and whether those anchors were confirmed before the trade.
Risk Control
Place invalidation where the trade premise fails, such as beyond the far window edge or a confirmed structural level, with a buffer appropriate to the instrument. A stop order does not guarantee that price. Overnight gaps, spreads, slippage and short-borrow constraints can materially change realized losses.
| Risk element | Practical rule | Reason |
|---|---|---|
| Position size | Risk budget ÷ planned loss per unit, rounded down. | A wider gap or stop usually requires a smaller position. |
| Target | Use a pre-existing level or explicit reward-to-risk rule. | Avoid selecting a favorable target after seeing the move. |
| Setup expiry | Specify a maximum number of bars for the trigger. | An old unfilled gap is not an indefinitely valid entry. |
| Trade management | Define partial exits, trailing and overnight exposure in advance. | Changing rules mid-trade makes results difficult to compare. |
Pattern Confirmation and a Worked Setup
RSI, MACD and moving averages can describe momentum or trend, but overlapping indicators do not supply independent guarantees. State the exact condition—such as a completed close above a chosen moving average—and avoid adding filters solely because they improve one historical sample.
Suppose a stock’s first candle has a $100 high and the next completed candle has a $103 low and $106 high. The rising window spans $100–$103. If a later trigger enters at $106.50 with a $99.50 stop, planned risk is $7 per share. A $140 risk budget permits 20 shares before costs. A $120.50 target offers $14 per share, or 2R. All prices are hypothetical; the target must also be assessed against the chart’s actual resistance.
Advanced Pattern Trading
Multiple-Time-Frame Strategy
Use daily or weekly charts for broader context, a four-hour chart for setup development, and one-hour or 15-minute charts for a defined entry if that suits the market. A daily window and a lower-timeframe session gap are not interchangeable observations. When using higher-timeframe conditions, use only candles completed by the decision time.
Quant Charts workspaces help keep those views organized. Preserve the symbol, session and interval for each view so that later research reproduces the same setup.
Strategy Testing with Quant
Start with a study that separates pattern measurement from order execution. Ask Quant, our coding agent:
On completed ordinary candles, flag rising windows where low is above the previous high and falling windows where high is below the previous low. Record gap size, symbol, interval and session. Report the next five-bar close return and whether price touches the far gap edge within five bars. Use only prior completed bars for a 20-bar volume baseline. Report each direction separately and do not assume any trade fills.
Those five-bar outcomes are research choices, not universal window rules. Inspect the generated code and run it manually, following Making Strategies with Quant. Check selected signals against the raw candles, including gaps that fail.
Then add the chosen trend filter, entry timing, stop, target, sizing, costs and overlap policy. If one bar touches both stop and target, do not assume the favorable order without suitable intrabar evidence. Reserve unseen data, compare neighboring parameters and record every variation tried. A Quant backtest does not by itself validate a window strategy.
Trend-Trading Integration
A hypothetical Tesla-style bearish sequence could show a bearish pin bar, a gap down, and a bearish marubozu. The actual window test still depends on the two candle ranges, not their names. Conversely, an Alphabet-style earnings gap may initially rise but later fill; positive news alone does not establish a successful entry. These are illustrative scenarios, not verified dated trades or recommendations.
Main Takeaways
Identify full-range separation, confirm the second candle, and distinguish the window from other gap definitions. Study volume and trend as explicit context. Plan for continuation, partial retracement and full closure instead of assuming that the gap must hold or fill on schedule.
Getting Started
Practice on historical charts and demo accounts, recording losing and missed setups as well as winners. Use LuxAlgo’s Library for transparent tools and Quant Charts for chart analysis, then develop testable rules with Quant. Check each product’s current platform availability rather than assuming an identically named tool exists on TradingView, NinjaTrader and MetaTrader.
Falling Windows Patterns
Frequently Asked Questions
What is a rising window?
A full-range gap where the second completed candle’s low is above the previous candle’s high. Its conventional continuation context is an uptrend.
What is a falling window?
A full-range gap where the second completed candle’s high is below the previous candle’s low. Its conventional continuation context is a downtrend.
Is every opening gap a window?
No. A gap between the previous close and new open can occur even when candle ranges overlap. A strict window requires separation of the adjacent full ranges.
Do windows always fill?
No fixed fill outcome or deadline is guaranteed. Historical average and median closure times describe a particular sample, not a holding-period recommendation.
Does an imbalance fill percentage show win rate?
No. It measures fills under the indicator’s definition and sample, rather than profitable trades under an entry, stop, target and cost model.
How can Quant help research windows?
Specify adjacent-bar conditions, confirmation timing, context and outcomes. Inspect the generated code and run it manually before adding execution and risk assumptions.
References
LuxAlgo Resources
- LuxAlgo Quant
- Making Strategies with Quant
- Quant Charts Data and Market Coverage
- Imbalance Detector
- Imbalance Detector: Original LuxAlgo Publication
External Resources
Read next