Wyckoff Distribution: Key Pattern Explained
Wyckoff distribution is a framework for studying how an uptrend may give way to a trading range and then a decline. Analysts examine price, volume, and the quality of rallies and reactions to assess whether supply appears to be overcoming demand. The framework helps organize a market hypothesis; a chart alone cannot prove that institutions are selling to retail traders.
LuxAlgo’s charting and AI platform can make that analysis more repeatable. Use Quant Charts to mark the range, inspect the Wyckoff Distribution Schematic tool in the Library, and use Quant, our coding agent, to develop explicit research rules. Keep the observed price behavior separate from the story used to explain it.
Quick Overview
- Context: a range after an advance may be distribution, but it may also resolve as re-accumulation and continue upward.
- Evidence: compare price spread, volume, rally quality, and reactions near the range boundaries.
- Phases: A through E describe a progression, not a mandatory sequence of identical chart shapes.
- Trading: define the trigger, invalidation, sizing, and costs. A phase label is not a complete trading strategy.
Main Concepts of Wyckoff Theory
The StockCharts Wyckoff tutorial explains the method’s three laws and the distribution terminology. They provide an analytical framework rather than a direct view of participants’ inventories or intentions.
Supply and Demand
Wyckoff analysis interprets the relationship between supply and demand through price and volume. In a possible distribution range, analysts look for reduced upward progress, failed rallies, and increasingly effective downward movement. High volume near a top can fit that interpretation, but it can also occur during other market events.
Every executed trade has a buyer and seller. Total volume is not a count of institutional sellers, and a candle does not reveal who initiated every trade. Wyckoff’s Composite Man is a conceptual device for studying coordinated-looking market behavior, not evidence that one actor controls a particular chart.
Cause and Effect
In the traditional method, the “cause” is assessed through horizontal counts on a Point and Figure chart and used to estimate a potential subsequent move. It is not simply the number of days spent sideways. Box size, reversal setting, and counting rules affect the projection, and a longer range does not guarantee a larger decline.
A tool that projects one trading-range height is using a different calculation from a traditional Point and Figure horizontal count. Label the projection method clearly. Either approach creates a planning reference rather than a price level the market must reach.
Effort vs. Result
Effort refers to activity, usually volume; result refers to the associated price movement. In this context, price spread means the candle’s high-low range, not the bid-ask spread. Compare several reactions within the same market and session before drawing conclusions.
| Observation | Possible interpretation | What remains uncertain |
|---|---|---|
| High volume with little upward progress near resistance | Supply may be absorbing demand. | Participant identity and whether a decline will follow. |
| Rallies with narrower ranges and less volume | Demand may be weakening relative to previous rallies. | Whether the pause will become distribution or another continuation. |
| A wide downward bar with increased volume | Selling pressure may be gaining effectiveness. | Whether the move will persist or reverse at support. |
| High volume with little downward progress near support | Supply may be meeting substantial demand. | Whether the range is re-accumulation; context can change the interpretation. |
A single high-volume, narrow-range bar can have different meanings depending on location and follow-through. Record what price does next instead of treating every effort-result mismatch as proof of selling by large institutions.
5 Stages of Wyckoff Distribution
The familiar five stages are usually called Phases A–E. The terms below describe roles within the framework. Real markets can omit events, repeat tests, or invalidate the entire distribution hypothesis.
Stage 1: Phase A — The Uptrend Stops
Preliminary supply (PSY) and a buying climax (BC) may signal that an advance is losing momentum. An automatic reaction (AR) follows, and a secondary test (ST) can revisit the upper area. The reaction low helps establish the lower boundary; the climax area helps define resistance. Some uptrends end through exhaustion without a dramatic climax.
Stage 2: Phase B — The Range Develops
Price moves between the developing boundaries, with repeated tests providing more observations about demand and supply. A secondary test, an upthrust, or an early sign of weakness can occur within this phase. Calling the area distribution remains an interpretation until subsequent behavior supports it; sideways movement alone is insufficient.
In a distribution schematic, AR means Automatic Reaction. “Automatic Rally” belongs to the accumulation context. Mixing those terms can reverse the role of the boundary being described.
Stage 3: Phase C — Demand Is Tested
An upthrust (UT) moves above resistance and then returns inside the range. An upthrust after distribution (UTAD) is associated with a later demand test. A UTAD is optional: some distribution structures develop without a final move above the range high. A failed rally can also occur at a lower level.
Do not label every brief overshoot a UTAD or assume that an upward breakout is a trap before the rejection occurs. Specify the resistance boundary, the maximum time allowed outside it, and the close that marks a failed break.
Stage 4: Phase D — Weakness Becomes More Apparent
A sign of weakness (SOW) is downward movement toward or through the range’s lower boundary, often with wider price spread and increased volume. A weak rally afterward may be labeled a last point of supply (LPSY). Several weak rallies can occur; the name does not mean you can know in advance which rally will be the last.
A lower high and support break strengthen the bearish hypothesis under this framework, but they do not guarantee a prolonged decline. Record the condition that would invalidate the reading, such as sustained recovery of the range under a predefined rule.
Stage 5: Phase E — Markdown
Phase E describes a downtrend beyond the trading range. Rallies may struggle near broken support and new lows may develop. The decline can later pause in another range, which could represent re-distribution or accumulation. Do not continue using the old bearish label regardless of new evidence.
Key Event Reference
| Label | Meaning in distribution | Observation to record |
|---|---|---|
| PSY | Preliminary supply | An early change in the character of the advance. |
| BC | Buying climax | A climactic advance candidate and its context. |
| AR | Automatic reaction | The reaction low that helps define range support. |
| ST | Secondary test | A later revisit to the upper region and its price-volume behavior. |
| UT / UTAD | Upthrust / upthrust after distribution | A failed excursion above resistance, with timing and phase context. |
| SOW | Sign of weakness | Downward progress toward or through range support. |
| LPSY | Last point of supply | A weak rally after weakness, evaluated with subsequent information. |
Reading Numerical Examples Carefully
For a hypothetical Bitcoin-style range, take an upper reference of $73,660 and a reaction low of $60,795. The range height is $12,865. A rally high of $71,680 is still below $73,660, so those numbers alone cannot establish an upthrust above that upper boundary. A lower resistance level would need to be explicitly defined before applying an upthrust label.
A later move to $54,344 would be below the hypothetical range low, while a rebound to $65,105 would be back inside it. Whether those moves qualify as SOW or LPSY depends on chronology, timeframe, volume, and the definition used. These numbers are illustrative inputs, not verified labels for Bitcoin’s Q1 2024 price action or evidence of institutional transactions.
Trading with Wyckoff Distribution
Recognizing Key Chart Patterns
- Define the prior trend, the range boundaries, and when those boundaries became identifiable.
- Compare successive rallies and reactions instead of looking only for a resemblance to a schematic.
- Record whether an apparent upthrust actually crossed the chosen resistance and returned within the allowed time.
- Distinguish a test of support from a completed breakdown, and identify the information available at that moment.
- Keep a competing re-accumulation scenario until your rule invalidates it.
Timing Your Trades: Entry and Exit
Two common research approaches are a short after a failed upper-boundary break and a short after a support break followed by a weak rally. They have different confirmation times and stop distances. A rule that waits for a completed candle cannot assume it filled at an earlier price within that candle.
Suppose a hypothetical range spans $95–$105. After a support break, a weak rally provides a planned short entry at $94 with invalidation at $97. The price risk is $3 per share. A $150 risk budget permits 50 shares before costs; a target at $88 offers $6 per share, or 2R. The target and stop are chosen for this example and are not universal Wyckoff settings.
Size the position for the selected invalidation distance and instrument value. Include spread, fees, slippage, and borrowing or funding costs where applicable. Stop orders can fill worse than their trigger, and short positions have risks that differ from unlevered long positions. Decide how to handle a return into the range before entering.
Risk Management and Strategy Validation
Separate the pattern study from the trading strategy. A useful study can count failed breaks, support failures, or weak rallies without assuming any order fills. A complete strategy adds entry timing, order type, stop, target, sizing, overlap rules, and costs.
- Use completed higher-timeframe candles only after their close was available.
- Account for pivot-confirmation lag; do not backdate an entry to a pivot that required later bars.
- Compare results after costs, including trade count, average outcome, drawdown, and exposure.
- Reserve unseen history, test nearby settings, and record how many variations you tried.
- Inspect the trades behind an equity curve. A favorable curve or a phase label does not establish robustness.
A LuxAlgo Workflow for Wyckoff Research
Inspect the Distribution Schematic Tool
The LuxAlgo Wyckoff Distribution Schematic provides a rule-based implementation in the Library. Its buying-climax conditions combine an established advance, price spread, and volume; its automatic-reaction low establishes support. The tool distinguishes failed upward resolution from markdown confirmation rather than labeling every range a completed distribution.
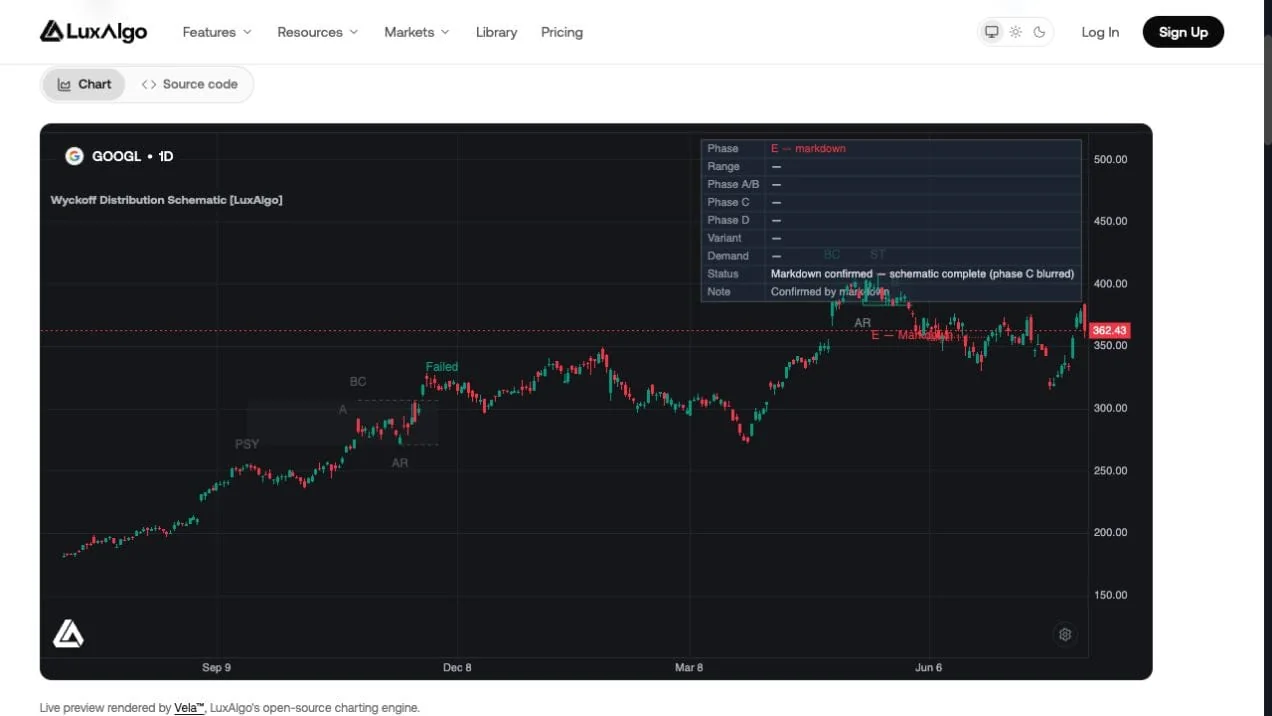
Settings matter. Swing Length controls pivot confirmation lag, the automatic-reaction window controls the allowed time for the reaction, and volume/spread thresholds grade events. The documented default for Markdown Confirmation Closes is two. Those defaults describe the implementation; they are not independently verified optimal settings.
The tool’s markdown target is a 1:1 range projection, distinct from a traditional Point and Figure count. Its FAQ also explains that when volume is absent, event checks fall back to price-spread signatures and the dashboard discloses this. A spread-only classification cannot supply the missing volume evidence.
Keep Chart and Data Context Consistent
Open the tool on Quant Charts and record the symbol, venue, timeframe, and settings. Use drawing tools to mark the range and invalidation, and preserve a screenshot of the original interpretation. An updated drawing or a newly confirmed pivot can otherwise make an earlier decision appear clearer than it was.
Review Quant Charts data coverage before interpreting volume. A single-exchange equity feed is not consolidated U.S. volume; crypto volume belongs to the selected exchange. Do not compare different feeds as though they capture the same activity, and do not treat unavailable volume as zero participation.
Develop Explicit Rules with Quant
Use Quant, our coding agent, to translate a specific part of the analysis into a study. For example:
Take a manually chosen support and resistance range with a recorded creation time. After that time, mark the first completed close above resistance followed within three bars by a close back inside. Record the failed-break event only when the return close is known. Keep the boundaries fixed and report events without assuming trades.
This specification studies one observable failed-break condition; it does not automate the entire discretionary Wyckoff method. Add the rest of the trading rules before evaluating returns. Follow Making Strategies with Quant: inspect the generated code and run it manually, then check sample events and fills against the chart. Do not assume that generating a strategy also performs a valid walk-forward evaluation.
Problem Solving and Advanced Methods
Spotting False Patterns
A schematic is a guide to relationships, not a template that price must copy. Weak rallies and downward expansion can support a distribution reading, while sustained strength above the range may contradict it. Record that contradiction instead of continuously moving the resistance or renaming phases to preserve the original view.
High activity with little price progress can reflect different conditions at support and resistance. Review several swings, the broader trend, and the next observable response. Multiple indicators based on the same price history do not automatically provide independent confirmation.
The Wyckoff Method: Distribution Video
Conclusion
Main Points
Wyckoff distribution organizes a possible transition from uptrend to range to markdown. Use the correct event definitions, treat the Composite Man as a model, and distinguish interpretation from observable evidence. An optional UTAD, a weak rally, or a high-volume bar cannot guarantee the next market move.
Steps to Improve Pattern Recognition
- Review historical ranges, recording both distribution and upward failures with the same definitions.
- Keep the original chart, settings, confirmation times, and volume source in the record.
- Use Quant Charts and the relevant Library tool to inspect events, then test explicit rules with Quant.
- Evaluate costs, drawdowns, unseen history, and rule deviations before relying on a favorable backtest.
Frequently Asked Questions
What is Wyckoff distribution?
It is a framework for analyzing a possible transition from an uptrend through a trading range into markdown, using price and volume relationships. It does not directly identify who owns or sells positions.
What does AR mean in distribution?
AR means Automatic Reaction. Its low helps establish range support. Automatic Rally is the corresponding term used in accumulation analysis.
Does every distribution require a UTAD?
No. A final upthrust above range resistance is optional. A distribution hypothesis can develop without that event, and an apparent range can also resolve upward.
Does high volume with little price movement prove institutional selling?
No. It describes an effort-result relationship whose meaning depends on location and subsequent behavior. Total volume alone does not establish participant identity or intent.
Is a range-height target the same as a Point and Figure count?
No. A range-height projection and a horizontal Point and Figure count are different calculations. State which method is used and treat the target as a planning reference.
How can Quant help research Wyckoff ideas?
Define observable events, confirmation times, entry, exits, sizing, and costs. Inspect the generated code and run it manually, then verify chart events and evaluate unseen history.
References
LuxAlgo Resources
- Wyckoff Distribution Schematic
- Quant Charts Drawing Tools
- Quant Charts Data and Market Coverage
- LuxAlgo Quant
- Making Strategies with Quant
External Resources
Read next