Concept
Wyckoff Distribution Schematic
Wyckoff Distribution Schematic, also known as PSY, BC, AR, ST, is a Wyckoff concept. The Library holds 1 implementation, a working definition you can pull into Quant.
phases A–E
Top Wyckoff Distribution Schematic indicator
The top custom implementation, built on the original standard Wyckoff Distribution Schematic formula.
1 total
The Wyckoff Distribution Schematic implementation below can become a backtested trading strategy — describe your rules and Quant writes the code.
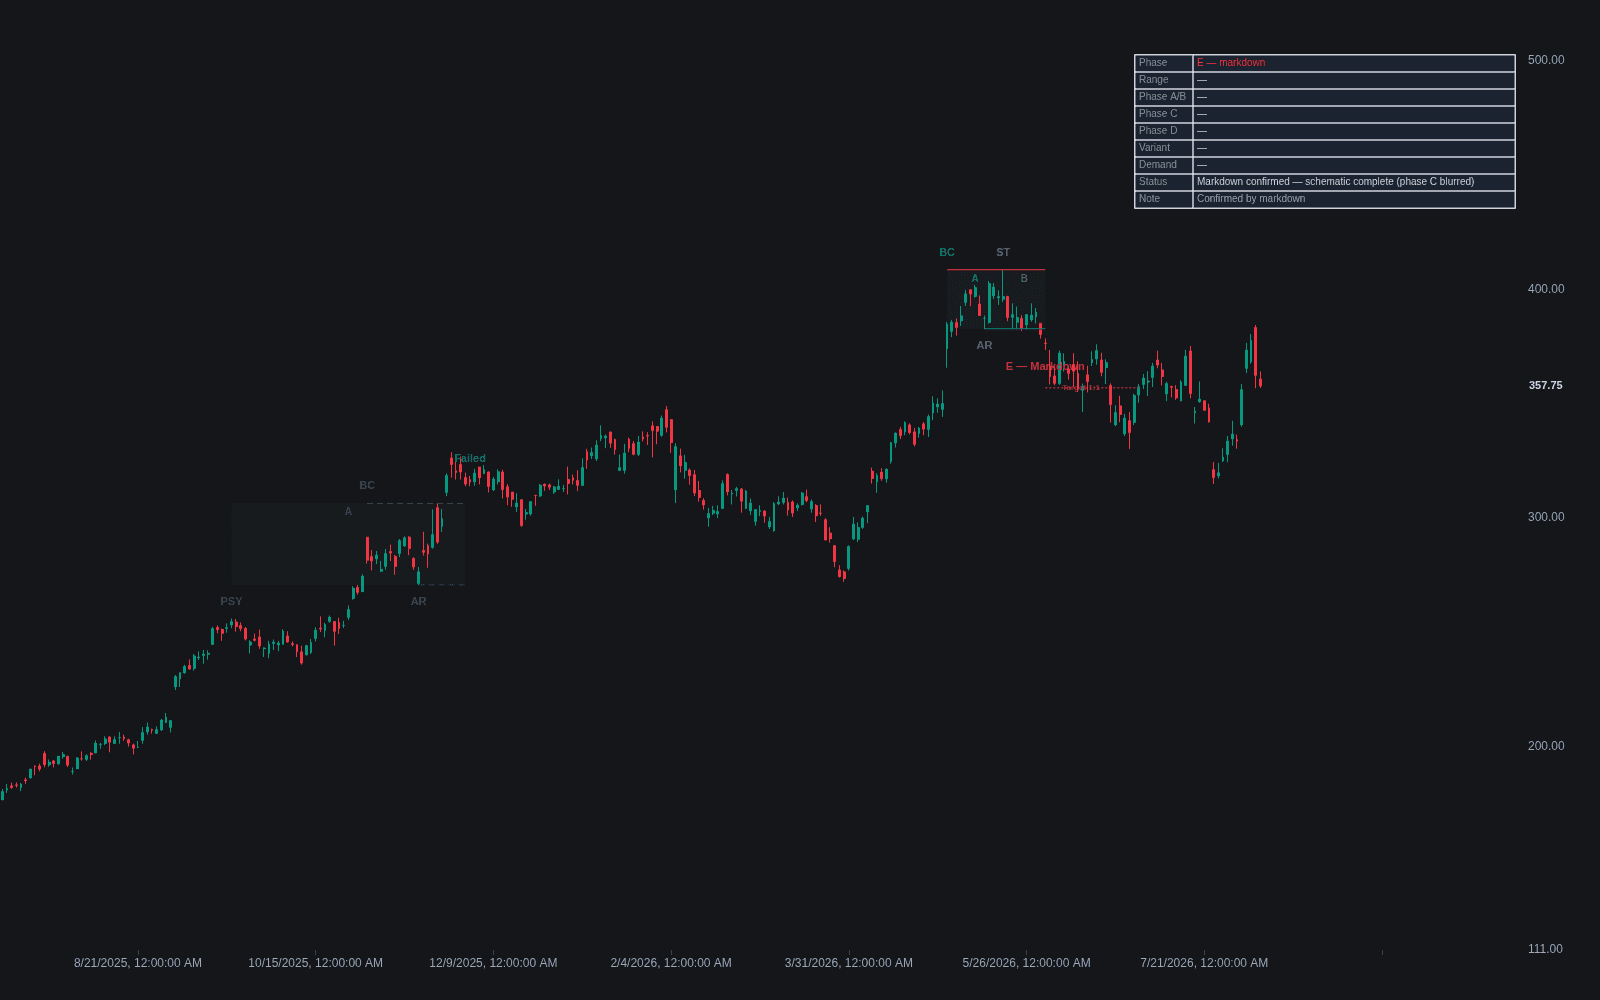
What is the Wyckoff Distribution Schematic?
The Wyckoff Distribution Schematic is the mirror of the Wyckoff Accumulation Schematic: the idealized map of how an uptrend is ended and a markdown prepared. Phase A stops the advance: preliminary supply (PSY), a buying climax (BC), an automatic reaction (AR), and a secondary test (ST) define the range. Phase B builds the cause, typically with failing pushes at the highs (upthrusts). Phase C often ends with an upthrust after distribution (UTAD), a final probe above resistance that fails. Phase D turns the range heavy: signs of weakness (SOW) break toward support on expanding volume, and last points of supply (LPSY) form as weak rallies. Phase E is markdown.
Like its bullish counterpart, the schematic grew out of the Wyckoff Method, Richard D. Wyckoff's early twentieth-century framework for reading the campaigns of large operators through price, volume, and the composite-operator premise. The specific labeled diagrams, and teaching imagery such as the ice, come from the course as taught after his death, notably by Robert G. Evans, whose creek-and-ice stories gave the events their folk names. The acronym set (PSY, BC, AR, ST, SOW, LPSY, UTAD) is the modern standardization of that teaching.
In the older Wyckoff teaching story, the range's support is nicknamed the ice: a sign of weakness that falls through the ice, followed by a feeble rally back to its underside, is the classic prelude to markdown. As with accumulation, the schematic is a sequence to recognize, not a script. Distribution and re-accumulation can look alike for most of a range, so phase C and D behavior, meaning failed upthrusts, weak rallies, and expanding down-volume, carries most of the diagnostic weight.
The diagnostic engine is the same effort vs result logic that governs accumulation, run in reverse. Heavy volume at the highs that produces no upside progress marks supply overcoming demand; rallies that narrow in spread and shrink in volume show demand withdrawing; and the UTAD is the mirror of the spring, a stop-running probe that proves the other side is absent. Cause and effect applies as well: the width and duration of the range traditionally set point-and-figure objectives for the markdown that follows.
How to identify Wyckoff distribution on a chart
Label events only after the reactions that define them, and keep the re-accumulation alternative alive until the range shows real weakness.
- 1Start from a mature uptrend and find phase A: preliminary supply where heavy selling first checks the advance, a buying climax on wide spread and very heavy volume, the automatic reaction that follows, and a secondary test of the climax high on narrower spread and lighter volume.
- 2Frame the range with the BC high and AR low, then track phase B: repeated failing pushes at or above resistance while down-swings begin to carry more volume than the rallies between them.
- 3Watch phase C for a UTAD: a final push above the range highs that fails to hold and closes back inside, often followed by its own weak test.
- 4Demand phase D evidence: a sign of weakness that breaks mid-range support or the ice on expanding spread and volume, then LPSY rallies that stall below broken levels on dull volume.
- 5Grade every rally with volume: distribution is confirmed by rallies that keep shrinking, and contradicted by pullbacks that dry up while price holds, the signature of absorption and re-accumulation.
How traders use it
- As a phase locator: label PSY, BC, AR, and ST to frame the range, then watch whether rallies keep failing at or above resistance while down-swings gain volume.
- As an entry framework: the classic shorts are the UTAD in phase C and the LPSY rallies in phase D, with stops above the relevant high and a sign of weakness as confirmation.
- As protection against premature reads: mid-range, distribution resembles re-accumulation, so Wyckoff practice withholds the bearish label until the range actually produces signs of weakness and failing rallies.
- For exit management on longs: the phase A and B signatures, climactic volume followed by failing pushes and heavier down-swings, are commonly used to scale out or tighten stops well before any short is considered.
- For target estimation: point-and-figure counts across the completed range traditionally project markdown objectives, treated as rough guides rather than promises.
- With wave measurement: Wyckoff Wave & Volume Studies put numbers on the rally-versus-decline comparison that the schematic otherwise reads by eye.
Wyckoff distribution vs. related Wyckoff concepts
Wyckoff Accumulation Schematic: The mirror: accumulation maps the end of a downtrend with a selling climax and spring where distribution has a buying climax and UTAD. The vocabularies correspond event for event, and mid-range the two structures are notoriously hard to tell apart.
Wyckoff Method: The parent framework: the three laws and the composite-operator premise. The distribution schematic is the method applied to one situation, the topping of an uptrend and the preparation of markdown.
Upthrust: The component event: an upthrust is any failed probe above range resistance and is common through phase B, while the UTAD is the terminal phase C version that sets up markdown. The schematic gives the single event its context.
Concept family
Wyckoff
17 concepts mapped · 17 in the Library
Wyckoff Distribution Schematic FAQ
Turn Wyckoff Distribution Schematic into a trading strategy.
Take the implementation from this page into Quant, then build on it, backtest it on real data, and keep refining it in conversation.