Concept
Point & Figure Cause Counting
Point & Figure Cause Counting, also known as horizontal count, stepping-stone confirmation, is a Wyckoff concept. The Library holds 1 implementation, a working definition you can pull into Quant.
Top Point & Figure Cause Counting indicator
The top custom implementation, built on the original standard Point & Figure Cause Counting formula.
1 total
This Point & Figure Cause Counting implementation is strategy-ready: open it in Quant, set your rules, and it backtests automatically.
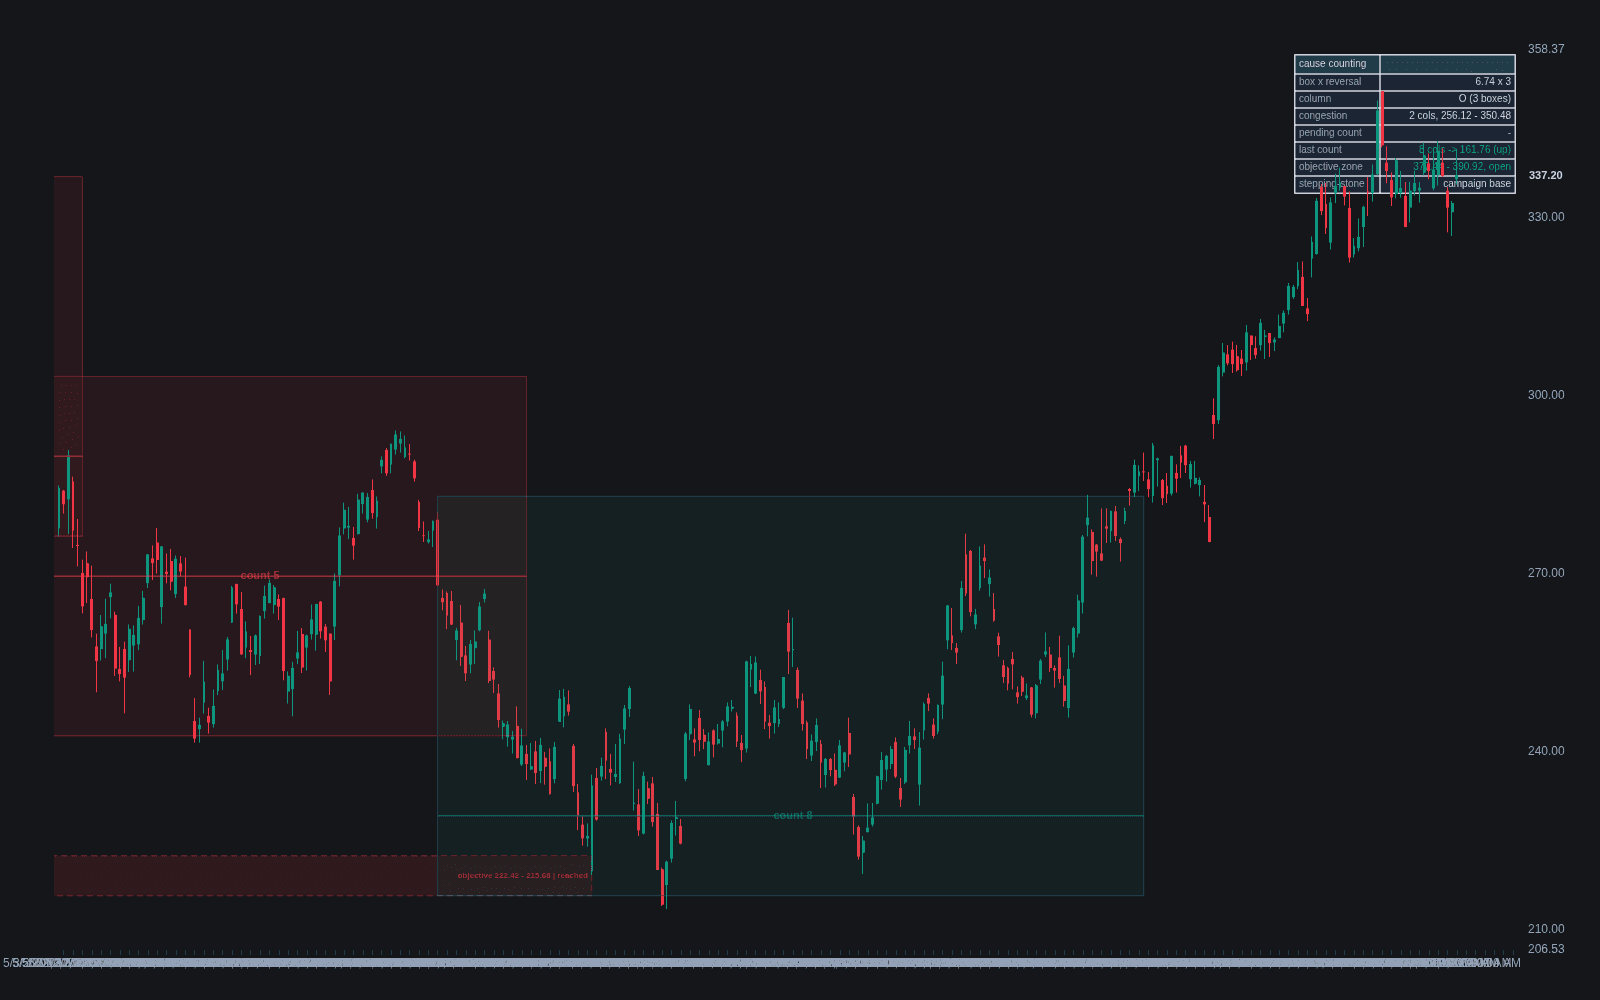
What is Point & Figure cause counting?
Point & Figure cause counting, often just called the horizontal count, is the Wyckoff technique of measuring the width of a completed trading range on a point & figure chart and projecting that width into a price objective for the move that follows. It is the practical arithmetic behind the Wyckoff law of cause and effect: the sideways congestion is the cause, the subsequent trend is the effect, and the count converts one into an estimate of the other.
The mechanic relies on a property unique to point & figure charts: because columns print only when price moves, not when time passes, the horizontal width of a range approximates how much two-sided trade was needed to complete the campaign. The analyst draws a count line across the range at a level where most columns are filled, counts the columns along it, multiplies by the box size and reversal value, and adds the product to a base level for upside objectives (or subtracts from a top level for downside objectives).
Wyckoff practitioners also use the count for what is often called stepping-stone confirmation: when the trend pauses, a count taken across the new congestion (re-accumulation in an uptrend) frequently projects to roughly the same objective as the original base, and agreement between the two counts raises confidence in the target. Counts are estimates of potential, not promises; ranges can deliver more or less than they project, and the count says nothing about timing.
How it's calculated
The standard horizontal count for an upside objective from an accumulation range:
Downside objectives from distribution mirror the arithmetic: subtract the projection from the range high or the count line level.
Conventions differ on where to anchor the count line and whether to segment long ranges into phases and add the segments; treat the resulting objective as a zone, not a precise level.
Classic Wyckoff counting was done on 1-box reversal charts, where the multiplier is simply the box size; multiplying by the reversal value is the common adaptation for 3-box charts.
How traders use it
- To set campaign targets: after a base resolves upward, the count gives an objective zone used for scaling out or for judging whether the remaining potential justifies holding through pullbacks.
- To size the opportunity before entry: one of the nine buying tests asks whether the base projects far enough to make the trade's reward-to-risk acceptable, and the count is how that is checked.
- For stepping-stone confirmation: counts taken across pauses within the trend are compared with the original base count, and convergence toward a common objective zone supports staying with the position.
- With honest limits: the count is an empirical rule of thumb, not a law of nature. Objectives are zones that markets overshoot and undershoot, counts are sensitive to box size and count-line choice, and a count should never override what current price and volume behavior is saying.
Cause counting vs related measuring techniques
Measured move: A measured move projects a vertical distance, the prior swing's length, from a breakout or pullback. Cause counting projects a horizontal quantity, the width of congestion, so the two answer the same question from different geometry.
Cause and effect: Cause and effect is the general law that moves are proportional to the preparation behind them; the horizontal count is its concrete measuring tool on a point & figure chart.
Concept family
Wyckoff
17 concepts mapped · 17 in the Library
Point & Figure Cause Counting FAQ
Turn Point & Figure Cause Counting into a trading strategy.
Take the implementation from this page into Quant, then build on it, backtest it on real data, and keep refining it in conversation.