Concept
Wyckoff Method
Wyckoff Method, also known as Wyckoff analysis, Wyckoff theory, is a Wyckoff concept. The Library holds 1 implementation, a working definition you can pull into Quant.
Top Wyckoff Method indicator
The top custom implementation, built on the original standard Wyckoff Method formula.
1 total
This Wyckoff Method implementation is strategy-ready: open it in Quant, set your rules, and it backtests automatically.
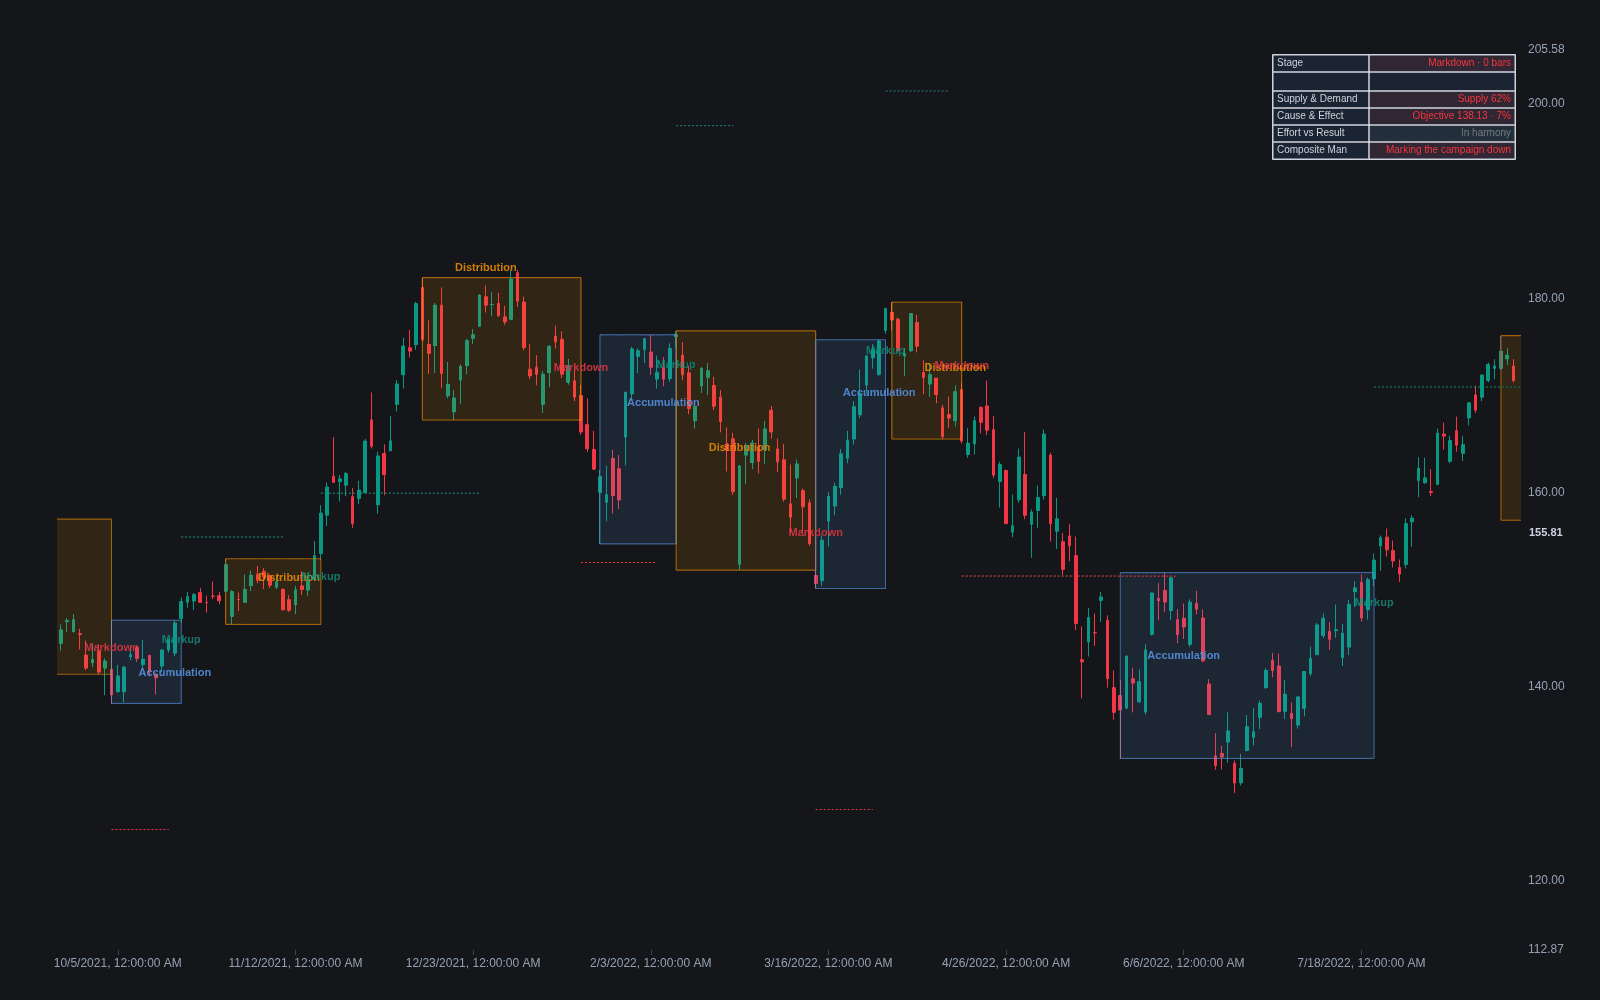
What is the Wyckoff Method?
The Wyckoff Method is a technical analysis framework built on a single premise: large, well-financed operators move markets in campaigns, and their activity leaves readable footprints in price and volume. It was developed by Richard D. Wyckoff (1873-1934), a Wall Street trader, broker, and publisher who founded The Ticker magazine in 1907, grew it into The Magazine of Wall Street, and condensed decades of observing the era's big operators into a formal course of instruction in 1931. His stated aim was to teach ordinary traders to judge the market by its own action rather than by tips, news, and rumor.
Three laws anchor the method. Supply and demand: price rises when demand overwhelms supply and falls when the reverse is true. Cause and effect: a sideways trading range builds a cause whose size is held to be proportional to the trend that follows, classically estimated with point-and-figure counts. And effort vs result: volume is effort, price movement is result, and a mismatch between them (heavy volume with little progress) warns that a move is being absorbed or nearing exhaustion. Wyckoff wrapped all of this in the Composite Man heuristic, reading every chart as if one deliberate operator were behind it.
On the chart, the method frames price as a four-stage cycle: accumulation, markup, distribution, markdown. The ranges at the turns are mapped with idealized templates, codified into their familiar modern form by the educators who carried Wyckoff's course forward after his death. The Wyckoff accumulation schematic labels a bottoming range through events such as the selling climax, automatic rally, secondary tests, and a terminal spring, while the Wyckoff distribution schematic mirrors it at tops with a buying climax and an upthrust. Each range is further divided into phases, A through E, moving from stopping the old trend to testing and finally trending out.
The method's influence is broad: Volume Spread Analysis builds directly on it, and much of today's smart money vocabulary covers recognizably similar ground in new terms. Its limits deserve equal billing. Event and phase labels are discretionary, they are far easier to assign in hindsight than in real time, and no broadly accepted statistical study demonstrates that the schematics predict outcomes. Seasoned practitioners tend to treat Wyckoff as a structured way to reason about supply and demand rather than a mechanical signal system.
How to identify Wyckoff structure on a chart
Wyckoff analysis works from the outside in: first establish that the prior trend has been stopped, then track how the resulting range behaves. The sequence below follows an accumulation base; distribution is read as its mirror image.
- 1Find the stopping action. After a sustained downtrend, look for a high-volume selling climax followed by a sharp automatic rally; those two extremes define the support and resistance of the developing range.
- 2Watch the secondary tests. Revisits of the climax low on progressively lighter volume suggest supply is drying up and being soaked up by larger buyers; see absorption for the mechanics.
- 3Look for a shakeout. A spring briefly breaks range support and quickly reclaims it; in distribution the equivalent is an upthrust above resistance. The speed and volume of the recovery are the tell.
- 4Require confirmation. A genuine sign of strength shows widening spread and expanding volume out of the range, followed by a quiet, shallow pullback (the last point of support). Check it against effort vs result.
- 5Compare the waves. Weigh the volume and progress of buying waves against selling waves as the range matures; Wyckoff wave and volume studies formalize exactly this comparison.
- 6Project objectives cautiously. Classical practice derived targets from the width of the range using point-and-figure counts; many modern traders use the range height or nearby structure instead, and treat any target as an estimate.
How traders use it
- Campaign context first: traders locate price within the accumulation, markup, distribution, markdown cycle and aim to trade only in harmony with that stage, for example avoiding fresh longs inside a suspected distribution range.
- Shakeout entries: buying a confirmed spring or shorting a failed upthrust is a classic Wyckoff entry, because the stop can be placed just beyond the shakeout extreme while the range itself provides a defined objective.
- Breakout filtering: a range break on narrow spread and shrinking volume fails the effort-vs-result test, so Wyckoff traders treat it as a potential trap rather than a sign of strength until volume confirms.
- Multi-timeframe execution: the schematic is mapped on a higher timeframe to set directional bias, while entries are refined on lower timeframes at secondary tests or the last point of support or supply.
- Beyond equities: the framework is widely applied to futures, crypto, and forex, with the caveat that spot forex volume is a tick-count proxy, which weakens the volume-dependent parts of the analysis.
- Automated annotation: community indicators attempt to label schematic events and wave volume automatically. They speed up chart markup but inherit the subjectivity of the rules they encode, so labels still need human review.
Wyckoff Method vs related concepts
Wyckoff Accumulation Schematic: The schematic is one artifact of the method, an idealized map of a single bottoming range. The method is the wider framework of laws, phases, and campaign logic that explains how to read and trade that map.
Effort vs Result: Effort vs result is one of Wyckoff's three laws and works bar by bar on any chart, even without full schematic analysis. The method embeds it in a larger structure of ranges, phases, and tests.
Spring: A spring is a single event inside an accumulation range. Wyckoff analysis supplies the context that gives it meaning; stripped of that context, a spring is just a failed breakdown that happened to recover.
Concept family
Wyckoff
17 concepts mapped · 17 in the Library
Wyckoff Method FAQ
Turn Wyckoff Method into a trading strategy.
Take the implementation from this page into Quant, then build on it, backtest it on real data, and keep refining it in conversation.