9:30 AM 15m Fib Breakout
 By LuxAlgoJun 22, 2026
9:30 AM 15m Fib Breakout is an indicator on Vela, our next-generation charting platform, written in Pine Script®.
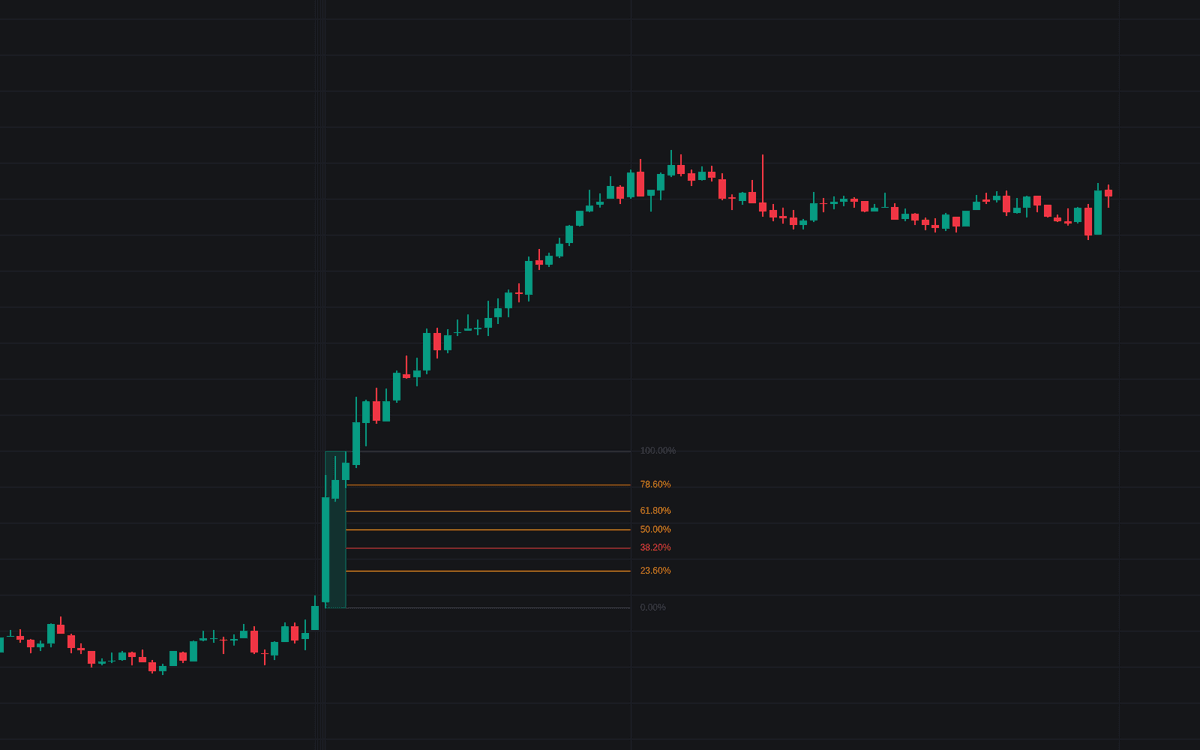

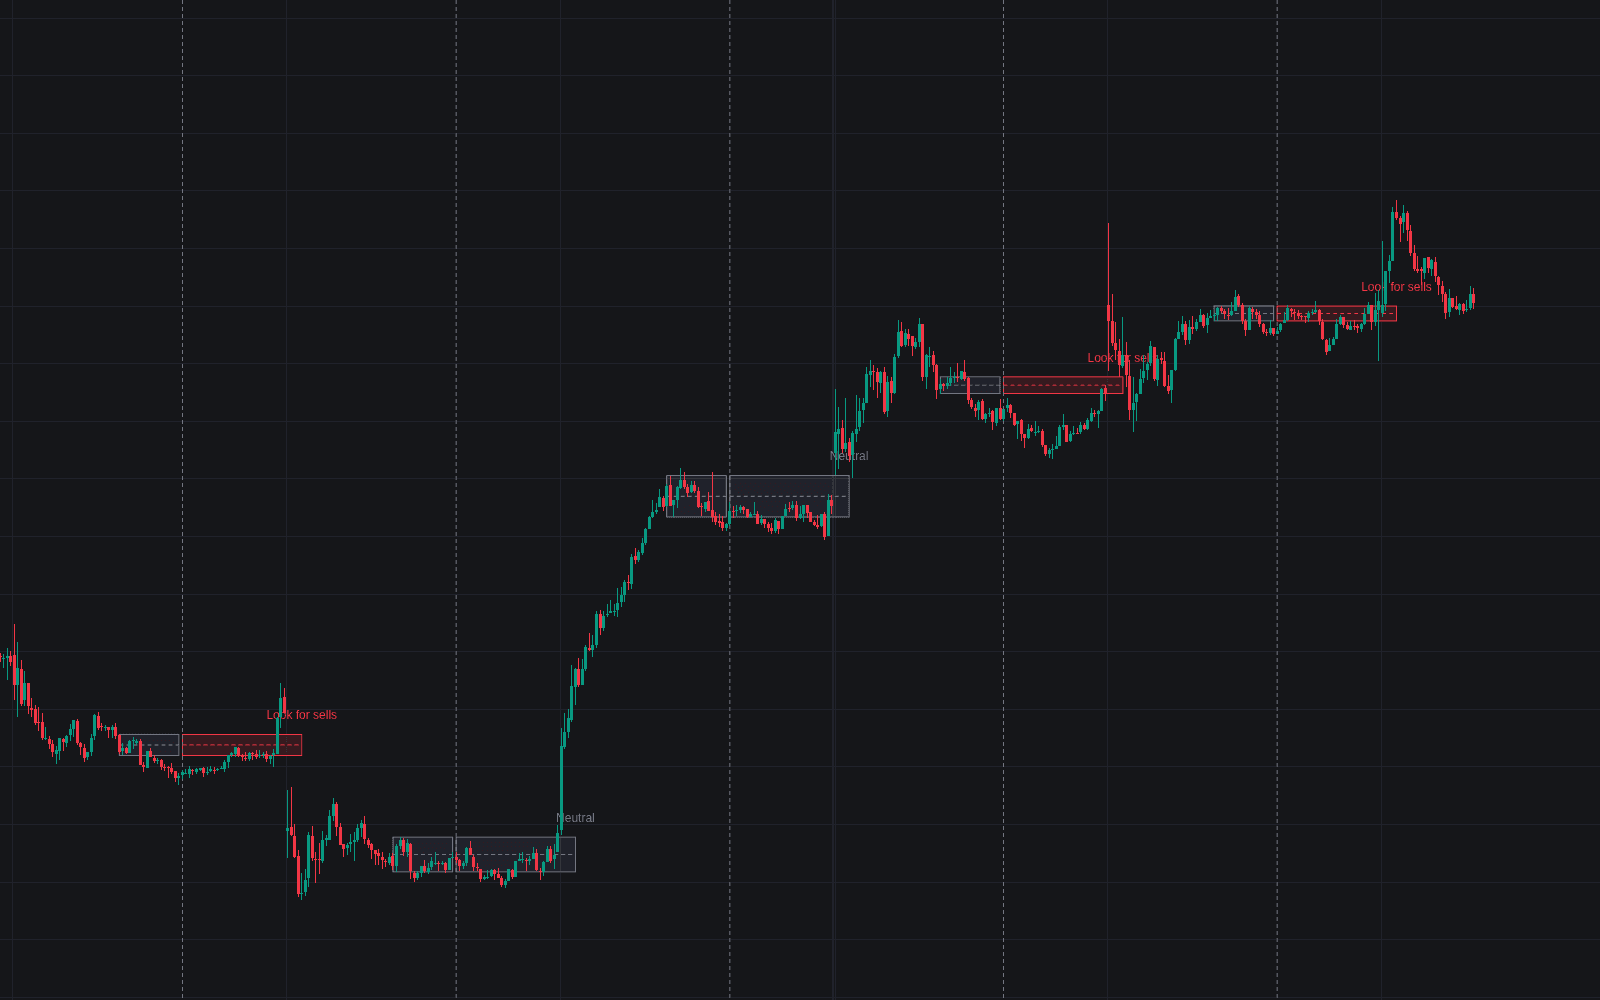
9:30 AM 15m Fib Breakout only cares about openings that actually move. It isolates the 9:30-9:45 New York window (classic opening range breakout territory) and compares that first candle's high-low span against the 15-minute Average True Range. When the span clears the ATR multiplier, the session qualifies as a high-momentum opening drive, and the tool draws Fibonacci levels from 0% to 100% across the opening candle's range, starting from the extreme opposite the close (the low on a bullish open, the high on a bearish one), holding them on the chart until 12:00 PM.
How to Trade the 9:30 AM 15m Fib Breakout?
- Bullish drive: a session close above the open projects the levels upward from the low. Watch them as pullback support for continuation entries through the morning.
- Bearish drive: a close below the open projects the levels down from the high, framing resistance for short setups or fades.
- No qualification, no levels: openings inside the ATR threshold get no Fibonacci projection; skipping quiet sessions is the filter's whole job.
Because the ATR is requested from the 15-minute timeframe regardless of your chart resolution, the volatility gate reads identically whether you execute on the one-minute or the fifteen.
9:30 AM 15m Fib Breakout Settings
- Timezone (default America/New_York): reference for session detection.
- ATR Length: lookback for the 15-minute ATR the opening candle is measured against.
- ATR Multiplier: the bar the range must clear. Raise it to demand rarer, more explosive opens; lower it to qualify more sessions.
Frequently Asked Questions
Free to use
Run it on Vela. Go further with a paid plan.
- Up to 500 strategy alerts, with webhook automation
- Up to 10× the chart history of Free
- Orderflow lookback up to full history
- More Quant usage to customize it, plus extra usage when you need it
- Futures data alongside crypto, stocks, forex and commodities
Also works on

Related indicators
All 6 Opening Range & ORB indicators
Run it on Vela. Make it yours with Quant.
Open this indicator free on Vela, our next-generation charting platform. Then ask Quant, our coding agent built into Vela, to retune it or turn it into a backtested strategy of your own.