Concept
Curve Position
Curve Position is a Support/Resistance & Levels concept. The Library holds 1 implementation, a working definition you can pull into Quant.
distance from equilibrium
Top Curve Position indicator
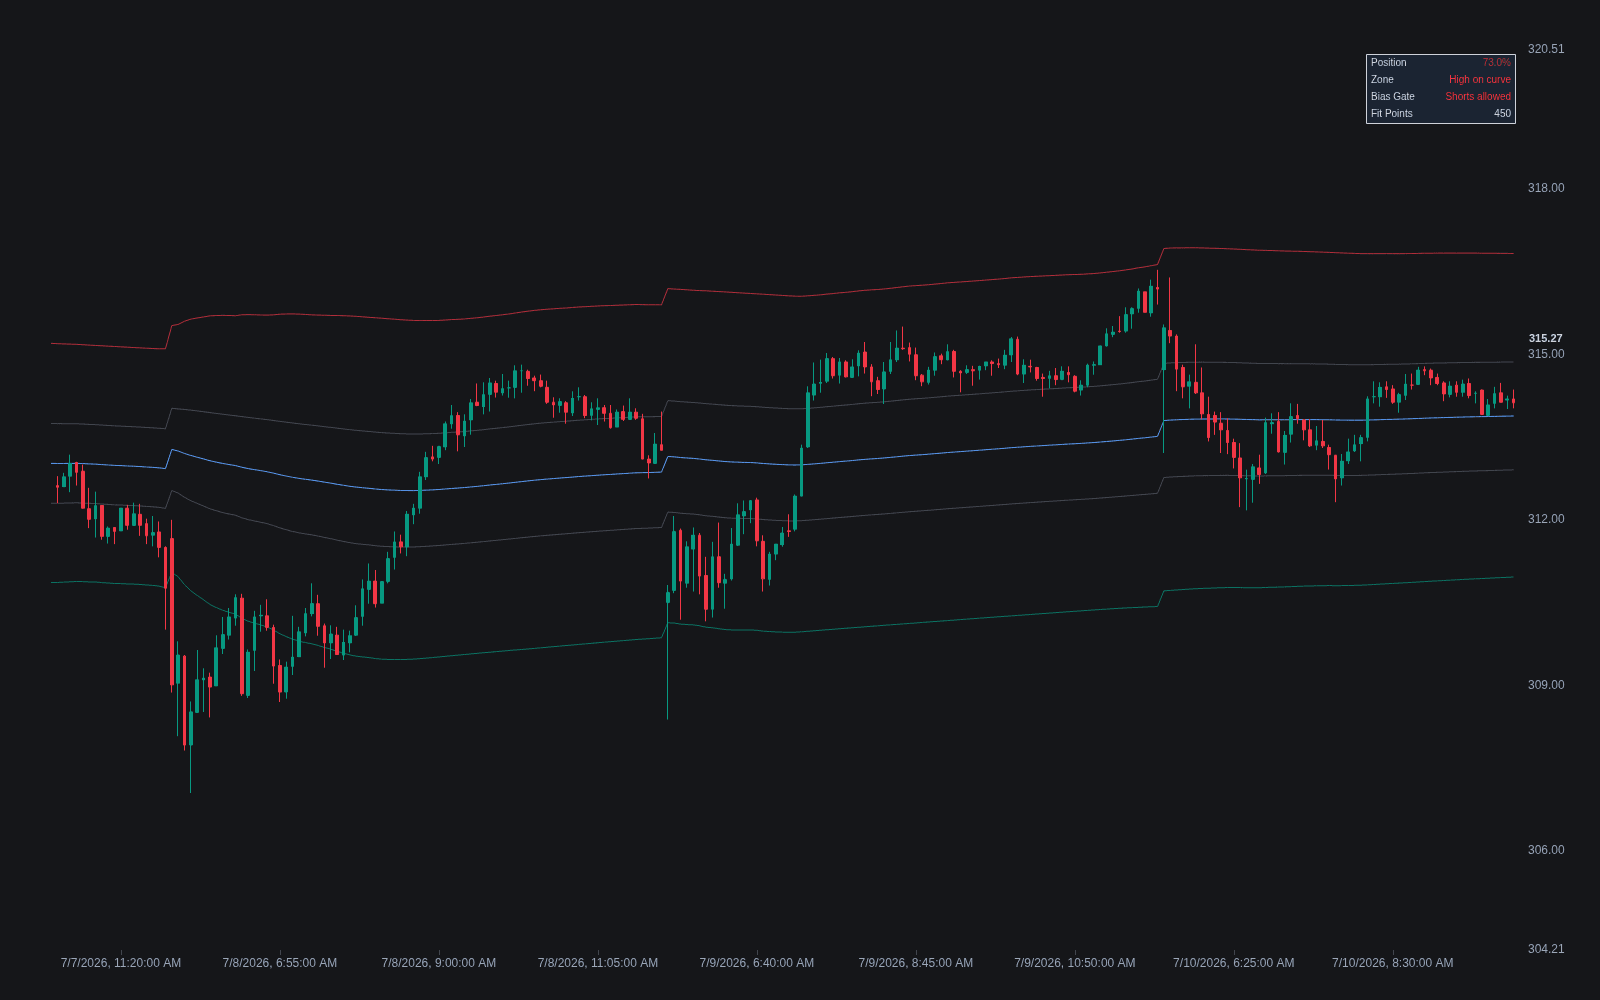
The top custom implementation, built on the original standard Curve Position formula.
1 total
From studying Curve Position to trading it: take the implementation below into Quant and backtest it instantly.
What is Curve Position?
Curve position is how supply-and-demand traders answer the question of where price sits in the bigger picture. The curve is the corridor between the freshest higher-timeframe supply and demand zones: price near the higher-timeframe demand floor is low on the curve (cheap, longs have location), price near higher-timeframe supply is high on the curve (expensive, shorts have location), and the middle of the corridor is equilibrium, where neither side has a location edge. Distance from equilibrium, not the lower-timeframe signal, decides which direction is even allowed.
The vocabulary borrows from economics, and the trading usage spread through zone-based methods popularized from the mid-2000s onward by educators such as Sam Seiden. The premise is that unfilled institutional orders rest where strong moves originated, so the freshest untouched zones above and below mark where real supply and demand wait. 'Where are we on the curve?' became the standard pre-trade question: buy near wholesale, sell near retail, and do nothing in between.
The same idea appears in other dialects. Smart Money Concepts expresses it as premium and discount around a range midpoint, and long-horizon models measure how stretched price is from a fitted growth curve. The common thread is that an entry inherits the quality of its location: identical zone-level signals mean different things high on the curve, low on it, or in the middle.
The reason location outranks the trigger is arithmetic. A long taken just above the higher-timeframe demand floor risks a small stop below the zone against target space spanning most of the corridor; the same trigger at equilibrium risks the same stop for half the room, and high on the curve it buys directly into the sellers it should be fading. Curve position turns that geometry into a rule applied before any support level or resistance level on the trading timeframe gets a vote, a filter that vetoes trades rather than generates them.
How to determine curve position on a chart
The curve is drawn once on a higher timeframe and then consulted from the execution chart, so most of the work is preparation.
- 1Pick the curve timeframe at least one step above the execution chart: weekly zones for daily entries, daily or four-hour zones for intraday trading.
- 2Mark the nearest fresh higher-timeframe supply zone above price and demand zone below, preferring zones that have not been revisited since they formed.
- 3Treat the corridor between them as the curve; a common convention splits it into thirds, with the lower third low on the curve, the upper third high, and the middle third equilibrium.
- 4Locate current price within the corridor and set the directional rule: longs allowed in the lower third, shorts in the upper third, patience in the middle.
- 5Redraw when the map changes: once a boundary zone is broken or consumed, anchor the corridor to the next fresh zones and reassess bias.
How traders use it
- As a direction gate: take longs only in the lower portion of the higher-timeframe curve and shorts only in the upper portion, and skip fresh signals that fire in the equilibrium middle where reward-to-risk is structurally poor.
- To set expectations and targets: a long taken low on the curve can reasonably aim across the corridor toward higher-timeframe supply, while the same setup near equilibrium gets a reduced target or a pass.
- To enforce timeframe discipline: define the curve at least one timeframe above the execution chart, weekly zones for daily entries or daily zones for intraday, so lower-timeframe trades inherit higher-timeframe location.
- As a filter over other level work: signals at floor pivots, prior period levels, or a mapped S/R zone are taken only when they agree with curve position, so the trading-timeframe map works inside the higher-timeframe one.
- As a management guide: a position taken low on the curve is held through equilibrium and scaled out into the far boundary, rather than exited at the first trading-timeframe reaction against it.
Curve Position vs. related frameworks
Supply & Demand Zones: Zones are the objects and curve position is the context built from them: a zone proposes where to enter, while the curve decides whether entries in that direction are worth taking at all.
Fib Retracement: A Fib retracement locates price within one measured swing, with 50% as its midpoint; curve position does the same job anchored to fresh zones instead of swing extremes, so the corridor updates when zones break rather than when a new swing prints.
S/R Zone: A generic S/R zone is a level where price has reacted before; curve position is not a level but the region between two zones, a bias framework rather than a trade location.
Concept family
Support/Resistance & Levels
38 concepts mapped · 38 in the Library
Curve Position FAQ
Turn Curve Position into a trading strategy.
Take the implementation from this page into Quant, then build on it, backtest it on real data, and keep refining it in conversation.