Fibonacci Trailing Stop
 By LuxAlgoSep 12, 2023
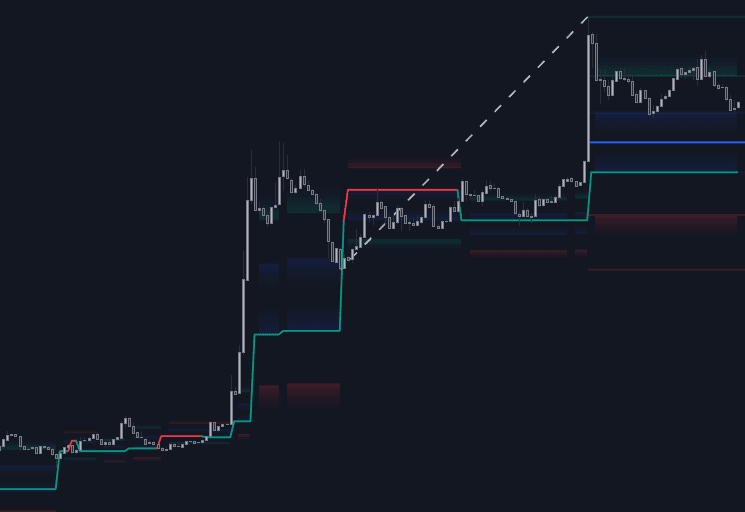
The Fibonacci Trailing Stop indicator leverages Fibonacci levels derived from the most recent swing high and low to construct a Trailing Stop-line that aids traders in identifying potential market trends and directions. This tool proves indispensable in trend-following strategies and offers insights for both novice and experienced traders. It is equipped with visual aids to support trading decisions and enhance trade management.
How to Use the Fibonacci Trailing Stop Indicator?
The Fibonacci Trailing Stop indicator serves as a guide to understanding current trend directions. By highlighting potential support and resistance areas through Fibonacci shadows, traders can make informed decisions. Shadows in the indicator can offer visual cues for these support/resistance areas, as seen in the detailed images provided.
Moreover, users can explore additional functionalities such as displaying Fibonacci retracement levels to gain deeper market insights.
Core Concepts
Understanding Basic Principles
Two fundamental ideas drive this indicator:
- New swings lead to the creation or update of Fibonacci patterns, which may alter the Fibonacci Trailing Stop (FTS).
- Trend identification relies on whether the FTS level/trigger, specified in settings, is crossed.
In an uptrend, Fibonacci levels align within the lower half of the pattern, while in a downtrend, they are situated in the upper half. This alignment provides a clear indication of trend shifts and continuation.
Once a trend direction ascertained, the Trailing Stop adapts accordingly, moving only in the trend's direction:
- Rising in an uptrend
- Falling in a downtrend
A breakthrough in the Trailing Stop line signifies a trend reversal.
A secondary line, color-filled, runs alongside the FTS line, crafted from minor swings.
Examples of Trend Shifts:
• A new bullish trend introducing a pattern and subsequent updates:
• Transition from Bearish to Bullish Trends, with updates and eventual reversals:
• Trend breakdowns indicating new directions:
• Oscillations between Bearish and Bullish Trends marked with breaches and crossovers:
Utilizing Shadows and Latest Fibonacci
The indicator provides functionalities to display:
- Latest Fibonacci levels
- Shadows, representing prior Fibonacci Levels, effective after a 1-bar delay
These shadows highlight pivotal support and resistance zones, especially where large shadow-blocks manifest.
Enabling shadows automatically removes the color fill on Latest Fibonacci and FTS to reduce chart clutter.
Customizing Settings
Swings Parameters
- L: Defines the left of pivothigh/pivotlow
- R: Defines the right of pivothigh
- Swing labels: Activates labels that exhibit swings aligned in the direction of the trend.
Configuring the Fibonacci Trailing Stop
- Level: Pre-set level options are available, ranging from -0.5 to 0.618, or traders can customize as needed.
- Trigger: Defines the criteria (close or wick) for identifying breaches in the FTS, considering highs in downtrends and lows in uptrends.
Fibonacci Display Options
- Latest Fibonacci: Shows the most current Fibonacci levels.
- Shadows: Option to exhibit past Fibonacci shadows, a useful tool for uncovering support and resistance zones.
FAQ
How do I access the Fibonacci Trailing Stop Indicator?
You can get access on the LuxAlgo Library for charting platforms like TradingView, MetaTrader (MT4/MT5), and NinjaTrader for free.
What is the best use case for this indicator?
This indicator is best suited for trend-following strategies and identifying potential support/resistance levels in various market conditions.
Can I customize the Fibonacci levels?
Yes, the indicator provides options to choose from pre-set Fibonacci levels or allows users to define custom levels to suit individual trading strategies.
By offering insights into trend directions and providing key support and resistance levels based on Fibonacci calculations, the Fibonacci Trailing Stop acts as a comprehensive tool for enhancing trading strategies.
Free indicator
Get free access to this indicator on the platforms below.

The Library is free. Quant makes it yours.
Pull any concept or indicator into Quant: rebuild it, retune it, or turn it into a backtested strategy of your own.