Statistical Trailing Stop
 By LuxAlgoApr 16, 2025
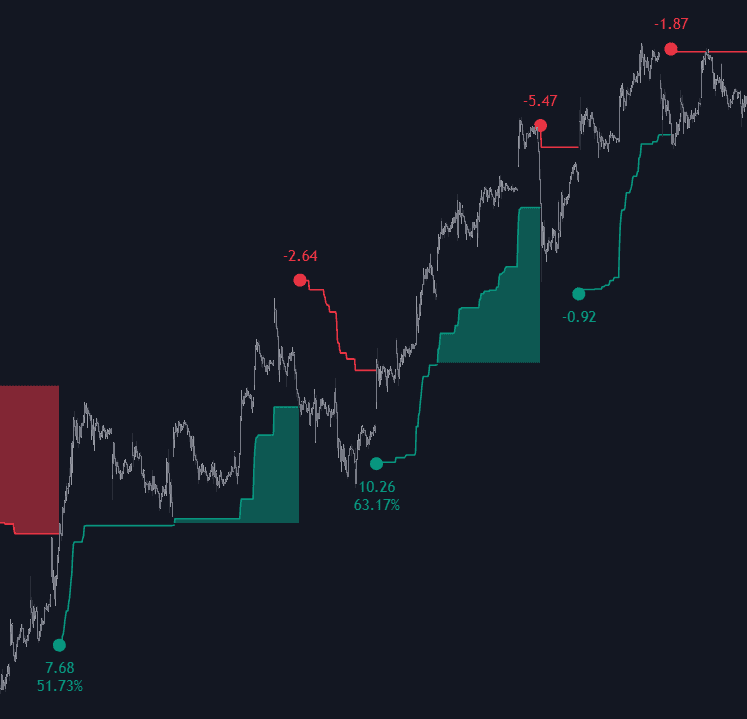

The Statistical Trailing Stop protects open profits with levels drawn from the statistical distribution of volatility rather than a fixed offset. It sits in the volatility-anchored branch of the trailing stop taxonomy: candles are grouped into blocks, recent blocks form a volatility sample treated as log-normal, and four trailing levels are derived from that distribution. A built-in dashboard logs the statistics of every signal the tool detects, so level selection rests on evidence, not hunches.
How to Trade the Statistical Trailing Stop?
- Level 0: the most responsive of the four: it hugs price and hands back the least profit, at the cost of more frequent stop-outs.
- Level 3: the most stable, tolerating deep pullbacks to stay with the larger trend.
- Levels 1–2: intermediate trade-offs between reactivity and staying power.
- Dashboard check: review the recorded signal statistics per level on your symbol and timeframe before committing to one.
The tool is deliberately plug-and-play: out of the box it groups 10 candles per volatility data point and runs its statistics over the most recent 100 groups. Like any volatility stop, it is built for trending conditions. The base level you trail from controls how sensitive it is to reversals.
Statistical Trailing Stop Settings
- Data Length: bars grouped into each volatility data point; larger blocks smooth the sample.
- Distribution Length: how many data points form the distribution the levels are drawn from.
- Base Level: which of the four statistical levels the stop trails; lower is tighter, higher rides out more turbulence.
- Show Statistics / Position / Size: dashboard visibility, placement, and scale.
Frequently Asked Questions
Free indicator
Get free access to this indicator on the platforms below.

The Library is free. Quant makes it yours.
Pull any concept or indicator into Quant: rebuild it, retune it, or turn it into a backtested strategy of your own.