HTF Sweep Signals
 By LuxAlgoJul 3, 2026
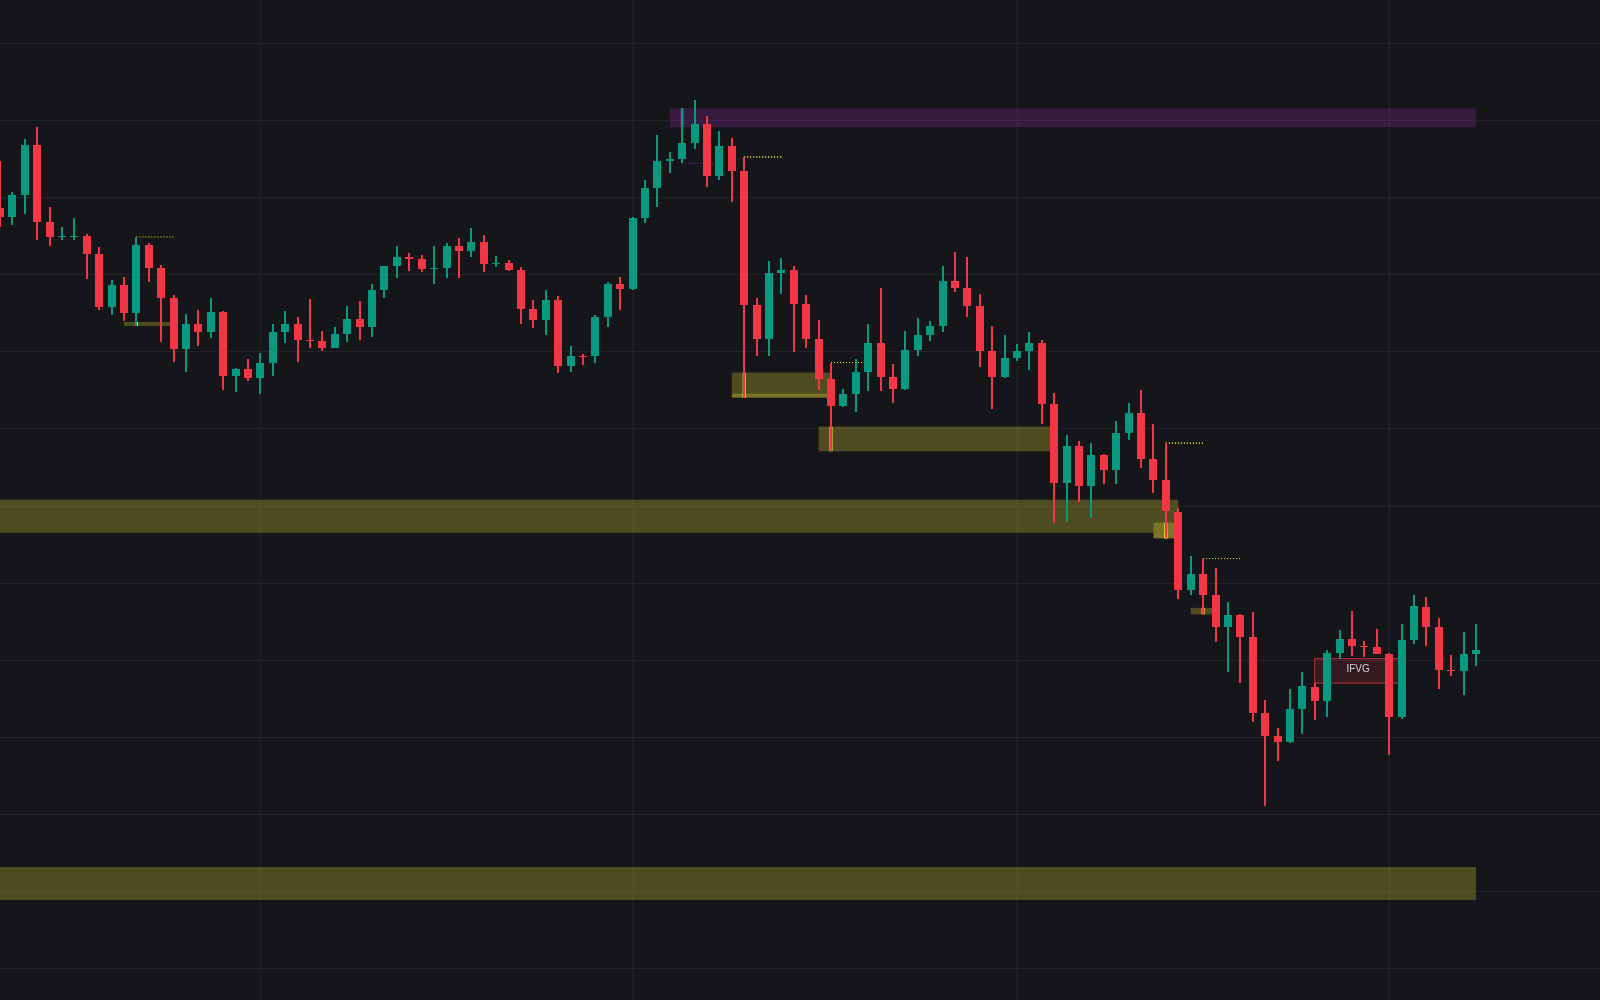
HTF Sweep Signals is an indicator on Vela, our next-generation charting platform, written in Pine Script®.
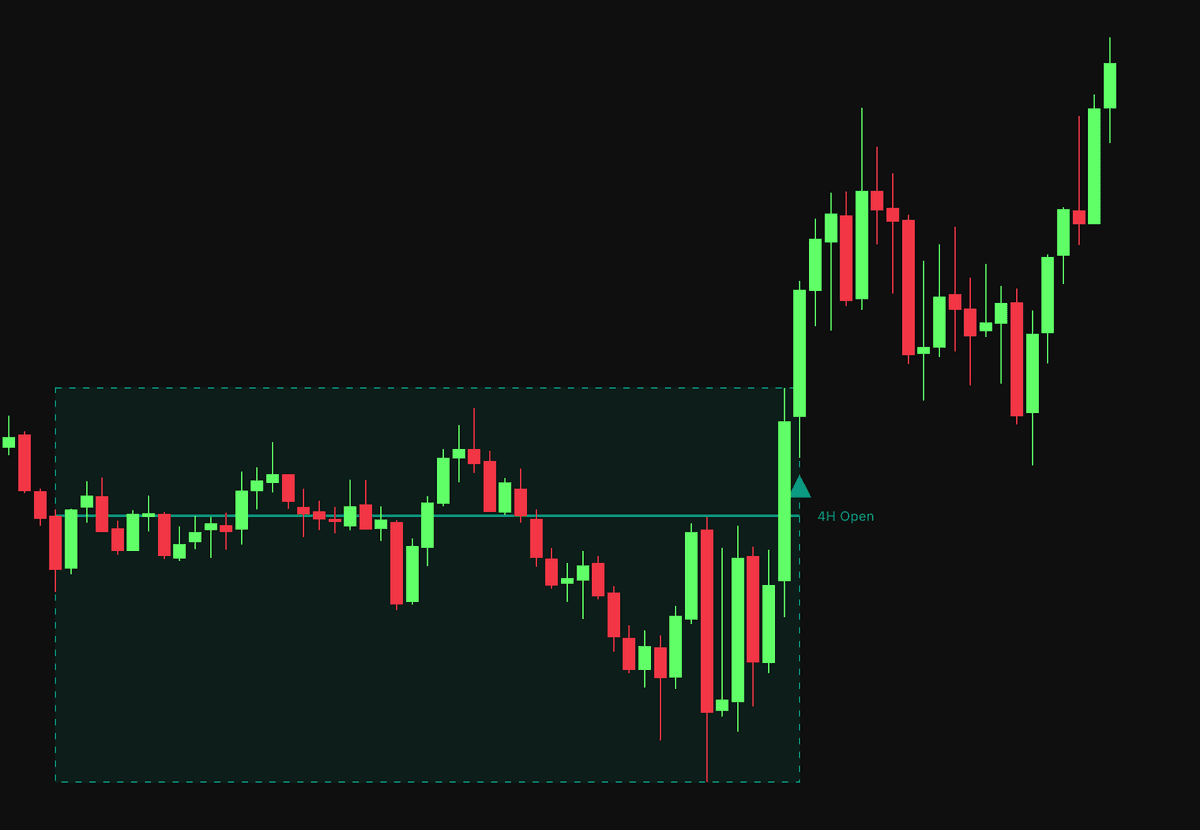
HTF Sweep Signals watches the previous higher timeframe high and low and prints a signal whenever one side gets run: price pierces the level, fills the resting orders, then closes back past the previous HTF close. That is a liquidity sweep, and catching it from a lower timeframe normally means juggling two charts; this build does the tracking for you and overlays the HTF range on the timeframe where you trade.
How to Trade the HTF Sweep Signals?
- Triangle below a bar (bullish sweep): price traded below the previous HTF low, then closed above the previous HTF close. Stops taken, downside rejected.
- Triangle above a bar (bearish sweep): price ran the previous HTF high and closed below the previous HTF close.
- Range overlay: on timeframes below the chosen one, a box spans the sweeping HTF candle's high–low range with a line at its open for orientation.
- Trend Signals enabled: bullish sweeps print only after a bullish HTF candle (close above open) and bearish sweeps only after a bearish one, keeping signals with the broader momentum.
A sweep that cannot hold beyond the level is the classic swing failure read: the breakout found no acceptance, and that failure is exactly what the marker flags. Signals appear immediately when your chart matches the chosen timeframe, while lower timeframe charts get the full visual overlay.
HTF Sweep Signals Settings
- Higher Timeframe: the timeframe whose prior high and low are monitored, 240 for four hours, 1440 for a day, or any value you prefer.
- Trend Signals: restricts signals to those aligned with the prior HTF candle's direction.
- One style pair sets the bullish and bearish colors used for signal shapes, box borders, and lines.
Frequently Asked Questions
Free to use
Run it on Vela. Go further with a paid plan.
- Up to 500 strategy alerts, with webhook automation
- Up to 10× the chart history of Free
- Orderflow lookback up to full history
- More Quant usage to customize it, plus extra usage when you need it
- Futures data alongside crypto, stocks, forex and commodities
Also works on

Related indicators
All 27 Liquidity Sweep indicators
Run it on Vela. Make it yours with Quant.
Open this indicator free on Vela, our next-generation charting platform. Then ask Quant, our coding agent built into Vela, to retune it or turn it into a backtested strategy of your own.