Indicator Configuration Forecasting
By LuxAlgoFeb 16, 2026

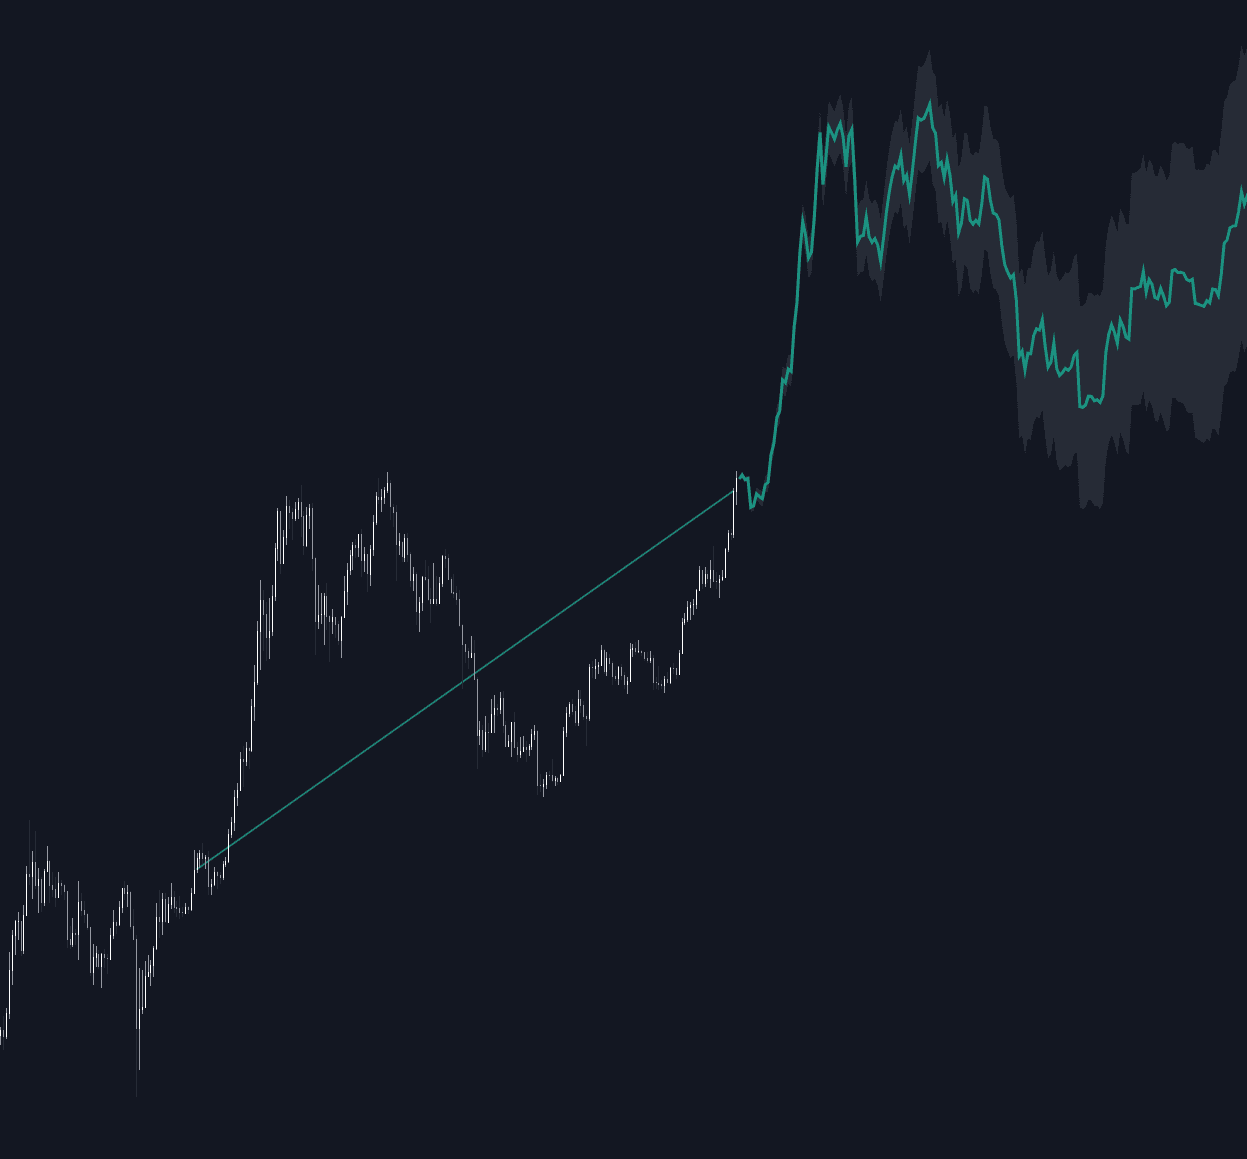
The Indicator Configuration Forecasting tool is a data-driven trading indicator that scans historical market regimes to find past technical configurations similar to the current one and projects a probabilistic forecast based on how price behaved afterward. By encoding multiple technical indicators into a structured state vector and applying a K-Nearest Neighbors (KNN) algorithm, this tool transforms technical analysis into a forward-looking trading strategy with a median forecast path and statistically derived confidence intervals.
Unlike traditional indicators that react to price, this trading indicator searches for historical analogs. When today’s technical setup closely resembles a prior market condition, the script analyzes what happened next and builds a projection from those outcomes—giving traders a structured, probability-based view of potential future price movement.
How to Trade the Indicator Configuration Forecasting Tool?
This forecasting trading indicator works by continuously “memorizing” the state of selected technical indicators at every bar. Each bar becomes a data point in a structured technical regime database.
When the current configuration matches or closely resembles a previous historical state, the script retrieves how price moved over the next N bars from those historical instances. The result is a forward projection derived from real, historical behavior—not speculation.
This makes the tool especially useful for:
- Regime-based trading strategies
- Mean reversion vs. trend continuation analysis
- Confluence-based discretionary trading
- Systematic probability overlays
- Market structure confirmation
Forecast Interpretation
The forecast output is visual and probability-driven, making it intuitive for both systematic and discretionary traders.
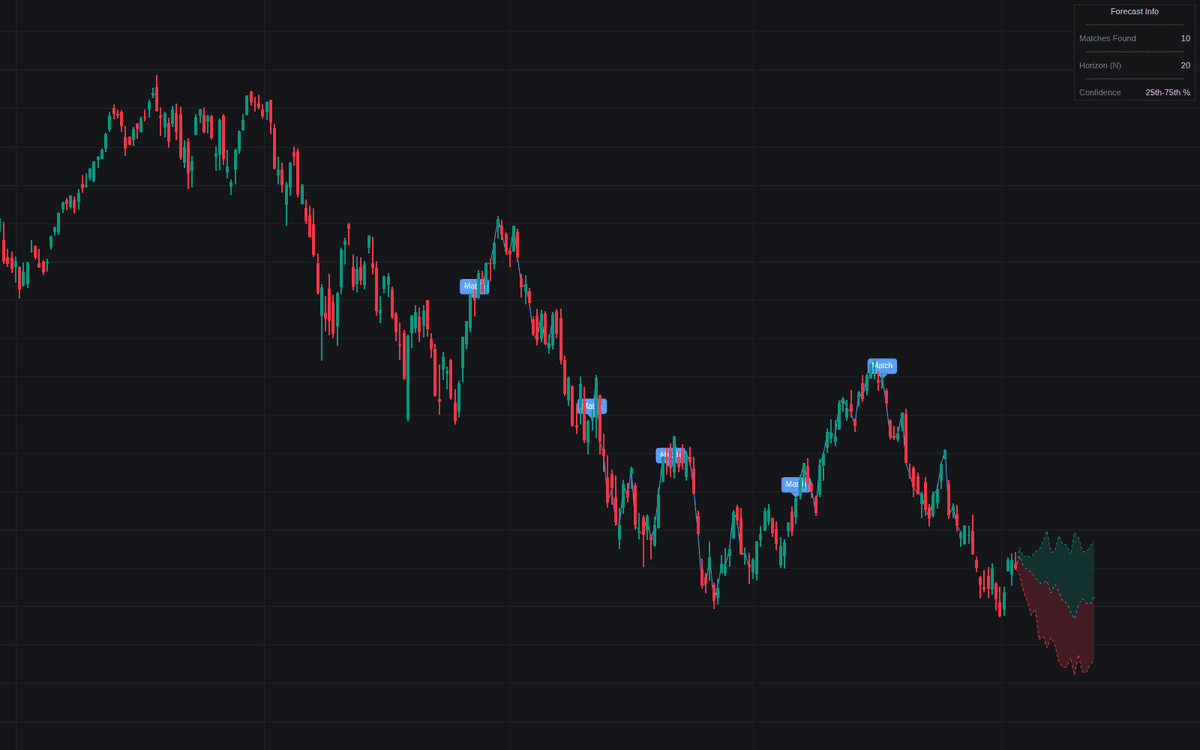
- Median Forecast (Dashed Gray): Represents the 50th percentile of all matched historical outcomes. This is the most statistically representative forward path.
- Upper Bound (Dashed Green): Represents the 75th percentile of historical outcomes, defining a bullish projection boundary.
- Lower Bound (Dashed Red): Represents the 25th percentile of historical outcomes, defining a bearish projection boundary.
- Match Labels: Small labels appear on historical price sections where similar technical configurations were identified, allowing full transparency into the analog selection.
The space between the upper and lower bounds functions as a probabilistic confidence interval, helping traders visually assess forecast dispersion and risk.
Building a Configuration-Based Trading Strategy
One of the most powerful aspects of this trading indicator is customization. You decide what defines a “similar” market.
For example:
- Enable only SMA Cross and Supertrend to forecast trend continuation scenarios.
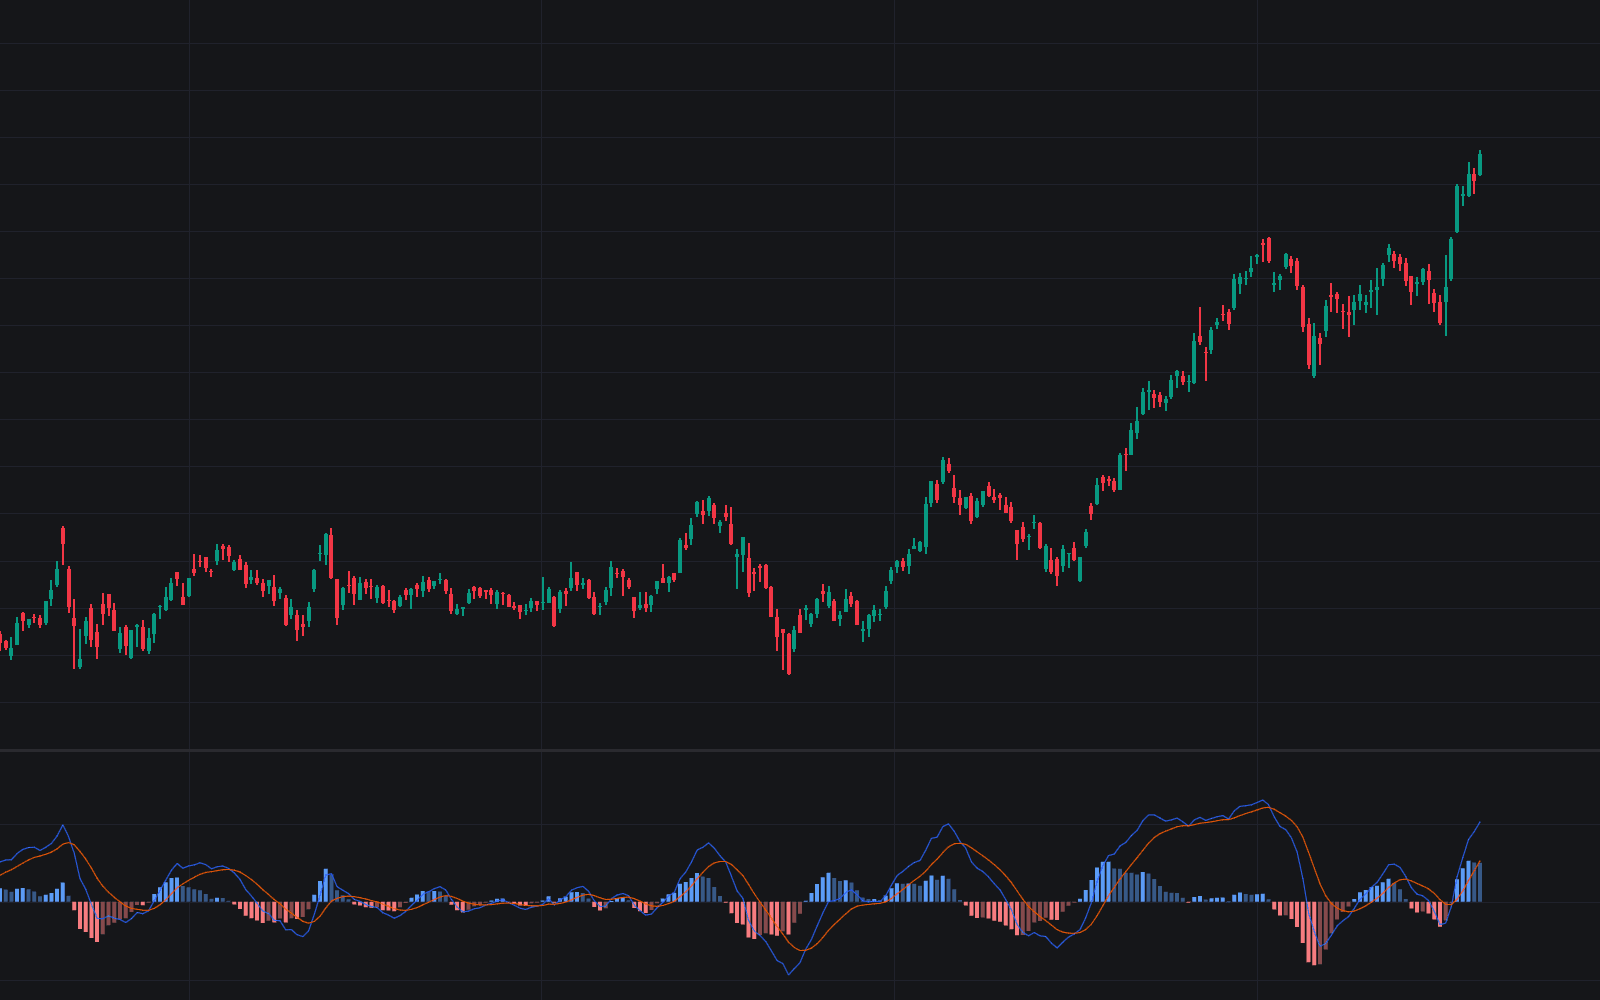
- Enable RSI + MACD to focus on momentum regime forecasting.
- Combine ADX + Supertrend + SMA to isolate strong trend environments.
- Use RSI alone to forecast mean-reversion setups.
If only “SMA Cross” and “Supertrend” are enabled, the script searches for historical bars where the moving average relationship and Supertrend direction were identical to the current bar—ignoring RSI, MACD, or other disabled inputs.
This modular configuration turns the indicator into a flexible trading strategy framework.
Technical Methodology Behind the Forecast
The script uses a state-encoding and similarity-search methodology designed for structured quantitative analysis.
Each enabled technical indicator is converted into a discrete regime value:
1→ Bullish state-1→ Bearish state0→ Neutral state
These values form a state vector representing the current market environment.
The algorithm then scans through the defined Historical Lookback period to compute vector distances between the current state and past states. Using a K-Nearest Neighbors (KNN) approach, it selects the “Top K” closest matches.
To maintain forecast integrity:
- Overlapping matches are filtered out
- Only distinct historical events are selected
- Regime diversity is preserved
Once the nearest neighbors are identified, the script calculates percentage returns over the specified Forecast Horizon (N) and projects those forward onto the current price to create the probabilistic forecast bands.
This transforms traditional technical analysis into a structured, machine-learning-inspired trading indicator.
SETTINGS
Parameters
- Top K Neighbors: Controls how many similar historical configurations are included. A lower value produces sharper but potentially noisier forecasts; a higher value smooths the projection.
- Forecast Horizon (N): Determines how many bars forward the forecast extends.
- Historical Lookback: Defines how far back in history the script searches for matching regimes.
These parameters allow traders to tune the model between precision and stability.
Indicator Configuration
You can toggle specific technical components to shape your regime definition:
- RSI: Matches overbought (>70) and oversold (<30) states.
- SMA Cross: Matches Fast vs. Slow SMA relationship.
- Supertrend: Matches trend direction.
- MACD: Matches MACD Line vs. Signal Line positioning.
- ADX: Can be used to isolate high or low trend strength regimes.
By adjusting these toggles, traders can construct highly specific trading strategies based on momentum, trend strength, volatility, or mean reversion dynamics.
Visibility & Style
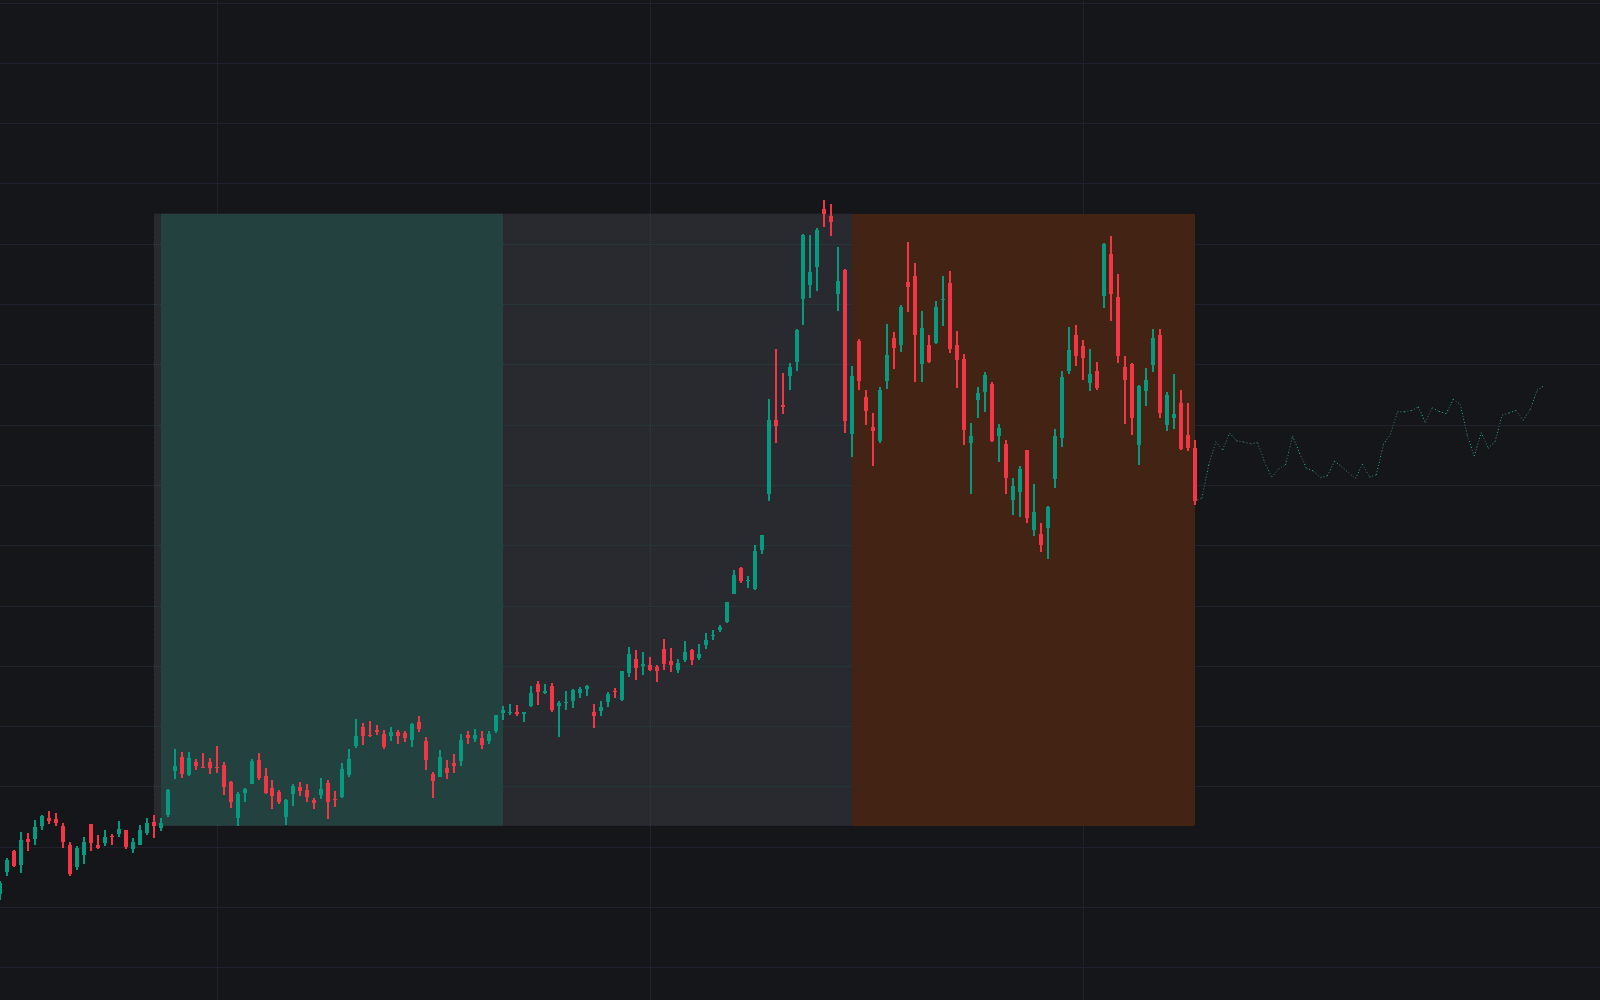
- Show Individual Match Paths: Displays historical price paths from matched regimes directly on the chart for transparent comparison.
- Median/Upper/Lower Colors: Fully customizable forecast line styling.
- Dashboard: Displays the number of matches found and overall forecast dispersion metrics.
This makes the tool suitable for both systematic traders and discretionary chart analysts.
Why Use Configuration-Based Forecasting in Trading?
Most trading indicators analyze the present. This tool analyzes the present in the context of the past.
Instead of asking:
- “Is RSI overbought?”
It asks:
- “When RSI, MACD, and Supertrend looked exactly like this before, what happened next?”
This regime-matching methodology provides:
- Structured probabilistic forecasting
- Reduced emotional bias
- Historical validation of setups
- Enhanced confluence for existing trading strategies
- Objective expectation framing
It is especially powerful when combined with LuxAlgo confirmation tools, volatility filters, and market structure analysis.
FAQ
What makes this different from a traditional trading indicator?
Traditional indicators react to price. The Indicator Configuration Forecasting tool searches historical market regimes with similar technical configurations and projects forward outcomes using a KNN-based similarity model.
Is this a predictive model?
It is a probabilistic forecasting tool based on historical analogs. It does not guarantee outcomes but provides statistically structured forward scenarios.
Can I build a trading strategy with it?
Yes. By selecting specific technical conditions (RSI, SMA Cross, Supertrend, MACD, ADX, etc.), you can define regime-based trading strategies and use the median and confidence bands for risk management and target planning.
How do I access the Indicator Configuration Forecasting tool?
You can get access on the LuxAlgo Library for charting platforms like TradingView, MetaTrader (MT4/MT5), and NinjaTrader for free.
Free indicator
Get free access to this indicator on the platforms below.
Unlock the entire LuxAlgo Library
Every indicator, every strategy, full charts, and complete access to Quant — our AI agent.