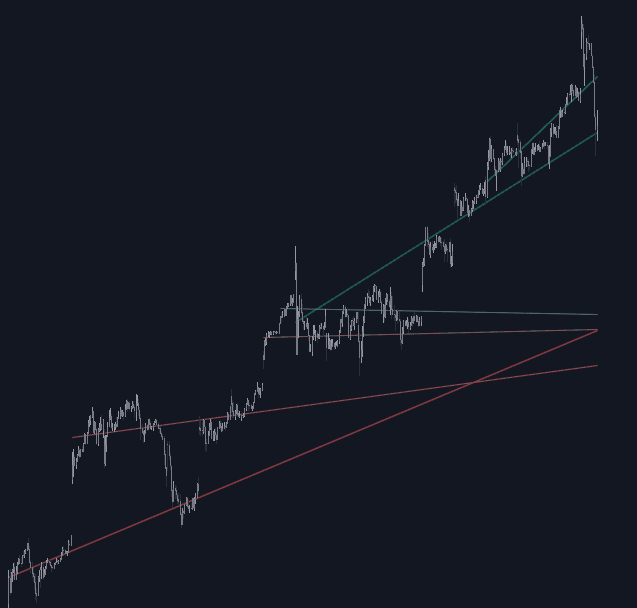
Machine Learning Trendlines Cluster
By LuxAlgoMar 19, 2025

The ML Trendlines Cluster indicator revolutionizes trendline identification by leveraging a sophisticated machine learning algorithm that combines k-means clustering with linear regression. This advanced approach automatically designates trendlines based on clustered price patterns, providing traders with an innovative tool for market analysis. Trendlines can be selectively adjusted based on their slope, offering the flexibility to include or exclude lines that do not meet the trader's criteria for market momentum or trend strength.
How to Trade the ML Trendlines Cluster Indicator?
The ML Trendlines Cluster is remarkably user-friendly. By simply defining the number of trendlines (or clusters) they want, traders can let the algorithm handle the complex calculation process. The default setting is to detect 4 clusters over the past 500 bars, but users can easily modify this, as shown in the image where 10 clusters are configured over the same time frame.
This methodology concentrates on illustrating trendlines formed by prices existing within the same trading range, providing a fresh angle compared to conventional trendline drawing methods. Notably, trendlines exhibiting a steeper slope indicate greater variance within their respective clusters, potentially revealing significant price movements.
Refining Trendline Slope Filtering
The ML Trendlines Cluster Indicator empowers traders to refine their chart view by filtering trendlines based on their slope. This feature allows for the visualization of only those trendlines that meet specified gradient criteria, either emphasizing more prominent slopes or favoring flatter ones.
The illustration above demonstrates the various configurations available:
- No filtering applied
- Filtering trendlines above a specific slope threshold
- Filtering trendlines below a specific slope threshold
In-Depth Technical Details
K-means clustering, a quintessential machine learning method, identifies similar observations within a dataset, grouping them to enhance the clarity of data interpretation. It initializes by assigning data points to preliminary groups, upon which centroids are calculated as the core of each group. This process is iterative, organizing groups to minimize variance between data points and their respective centroid.
Trendlines are plotted according to the linear regression outcomes computed for each cluster, offering traders precise visual insights into pricing trends.
Customizable Settings for Personalized Analysis
- Window Size: Sets the maximum number of bars from which data is gathered.
- Clusters: Determines the maximum number of clusters, or trendlines, to be identified.
Algorithmic Optimization
- Maximum Iteration Steps: Defines the cap on looping iterations necessary for cluster computation, ensuring efficient algorithm performance.
Slope Filtering Options
- Threshold Multiplier: Adjusts the sensitivity of the slope filter through a volatility-based multiplier, where a higher value indicates increased sensitivity.
- Filter Slopes: Toggle the trendline slope filtering on or off, allowing filtering for trendlines that are either above or below the specified threshold.
Visual Style Customization
- Upper Zone: Designates the color for the top chart area.
- Lower Zone: Designates the color for the bottom chart area.
- Lines: Defines the aesthetic style of the trendlines on the chart.
- Size: Controls the thickness of the lines for clearer visualization.
FAQ
How do I access the ML Trendlines Cluster Indicator?
You can get access on the LuxAlgo Library for charting platforms like TradingView, MetaTrader (MT4/MT5), and NinjaTrader for free.
What platforms are compatible with the ML Trendlines Cluster Indicator?
This indicator is designed for compatibility with popular charting platforms such as TradingView, MetaTrader (MT4/MT5), and NinjaTrader.
Can I customize the number of trendlines detected by the ML Trendlines Cluster Indicator?
Yes, users can specify the number of trendlines they would like the algorithm to detect, providing a highly customizable trading experience. This flexibility allows traders to tailor their analysis to specific market conditions or personal preferences.
Free indicator
Get free access to this indicator on the platforms below.
Unlock the entire LuxAlgo Library
Every indicator, every strategy, full charts, and complete access to Quant — our AI agent.