All indicators

Trendlines Oscillator

By LuxAlgoAug 20, 2025

Static chart image

The Trendlines Oscillator is a powerful trading indicator designed to help traders identify market trends and momentum by analyzing the relationship between price and trendlines. Unlike traditional oscillators, it uses the normalized distance between the current price and both bullish (support) and bearish (resistance) trendlines to generate momentum signals. This gives traders a dynamic way to assess whether buyers or sellers are in control of the market.

This indicator features bullish and bearish momentum lines, a signal line with crossings, and a variety of smoothing options to adapt to different trading styles. By visualizing the battle between support and resistance, traders can gain a deeper understanding of price action and better anticipate potential reversals or trend continuations.

How to Trade with the Trendlines Oscillator?

indicator image

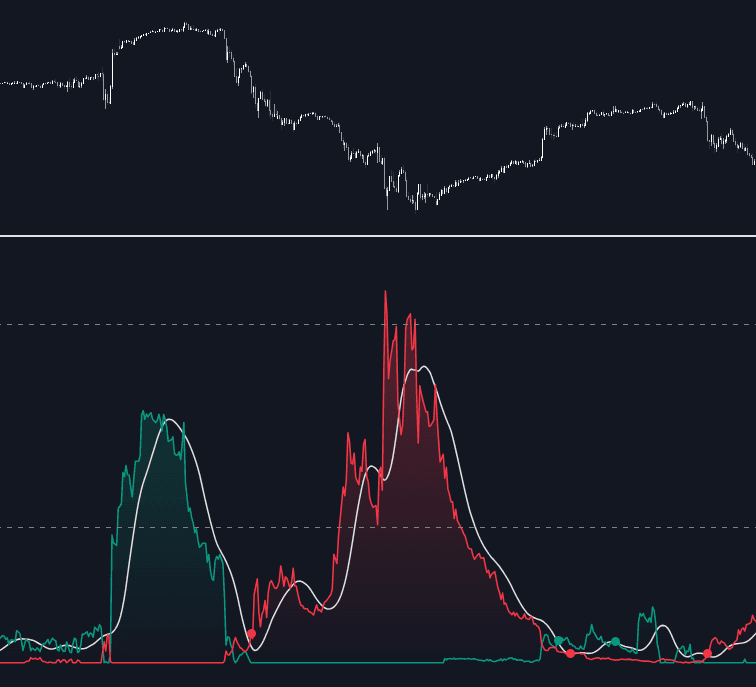
The oscillator displays three key lines:

  • Green Bullish Momentum Line: Measures buyer strength by calculating how far the price is from recent bullish support trendlines.
  • Red Bearish Momentum Line: Measures seller strength by calculating how far the price is from recent bearish resistance trendlines.
  • Signal Line: Provides crossovers with the momentum lines to highlight potential trading opportunities.

When the green bullish line stays above the red bearish line, it reflects stronger buying pressure, signaling that prices are holding well above support levels. Conversely, when the red bearish line dominates, sellers are exerting more influence, showing prices are closer to resistance.

The oscillator also plots dots when momentum lines cross the signal line, visually marking shifts in momentum that can be used as entry or exit confirmations.

How the Indicator Works

The Trendlines Oscillator works by systematically:

  1. Identifying pivot highs and lows.
  2. Connecting pivots to form bullish (support) and bearish (resistance) trendlines.
  3. Measuring the distance (delta) between the current price and those trendlines.
  4. Normalizing these distances between 0 and 100 to create momentum values.
  5. Smoothing the values for cleaner signals.
  6. Generating bullish and bearish signals when momentum crosses the signal line.

This unique approach goes beyond traditional moving averages or RSI-style oscillators, as it directly integrates structural market elements (trendlines) into the calculations.

Adjusting Length & Memory

indicator image

  • Length: Determines the size of market structure used for detecting trendlines. Larger values capture broader trends, while smaller values make the tool more sensitive to short-term moves.
  • Memory: Controls how many trendlines are considered in calculations. Higher memory values smooth out signals for long-term analysis, while smaller memory values offer quicker reactions.

This makes the oscillator adaptable for both scalpers who want faster signals and swing traders who prefer smoother momentum readings.

Smoothing Options

indicator image

The indicator includes extensive smoothing options:

  • Data Smoothing: Applies smoothing to the raw momentum values.
  • Signal Smoothing: Smooths the signal line itself for clearer crossover points.

Up to 10 smoothing methods are available, including common techniques like moving averages, allowing traders to customize responsiveness to market conditions.

Key Settings

  • Length: Size of structure used for trendline detection.
  • Memory: Number of trendlines considered in momentum calculations.
  • Source: Price input source (default is close).
  • Data Smoothing: Method and length for momentum values.
  • Signal Smoothing: Method and length for the signal line.

These settings allow traders to fine-tune the oscillator for different markets, from fast-moving crypto to slower-trending forex pairs or stocks.

Why Use the Trendlines Oscillator?

The Trendlines Oscillator trading indicator is ideal for traders who want:

  • A trendline-based view of momentum rather than relying solely on moving averages or RSI.
  • Clear visual crossovers to signal potential entries and exits.
  • Customizable smoothing for adapting to different trading styles.
  • A tool that highlights buyer vs seller dominance in real time.

By combining structural market analysis with momentum calculations, this tool provides a unique edge in spotting both trend continuation and reversal opportunities.

FAQ

What markets can I use the Trendlines Oscillator on?
It works across all markets—stocks, forex, futures, and crypto—on any timeframe.

How is this different from RSI or MACD?
Unlike RSI or MACD, which use price averages, the Trendlines Oscillator directly measures distances between price and trendlines, offering a more structure-driven view of momentum.

Can I use it for scalping?
Yes, by lowering the Length and Memory values, you can make the oscillator more responsive for intraday or scalping strategies.

How do I access the Trendlines Oscillator?
You can get access to the Trendlines Oscillator on the LuxAlgo Library for charting platforms like TradingView, MetaTrader (MT4/MT5), and NinjaTrader for free.

Free indicator

Get free access to this indicator on the platforms below.

TradingView
NinjaTrader
MetaTrader 4/5

The Library is free. Quant makes it yours.

Pull any concept or indicator into Quant: rebuild it, retune it, or turn it into a backtested strategy of your own.