All indicators

Trendline Breakout Navigator

By LuxAlgoApr 2, 2025

Static chart image
Price Action BasedSupport and ResistanceSignalsPivot Based (Retrospective)

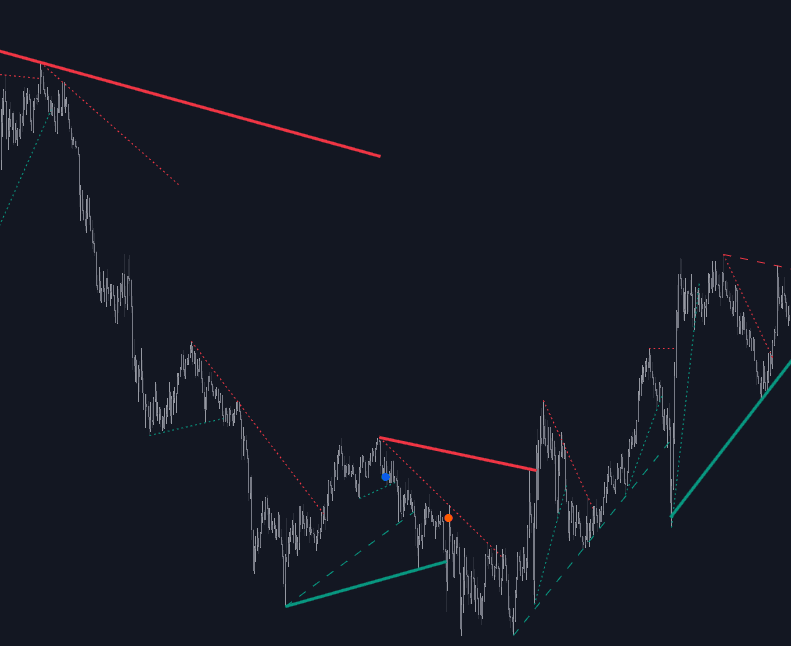
The Trendline Breakout Navigator is a powerful trading tool that displays three distinct trendlines, each representing varying levels of trend significance between Swing Points. It incorporates visual aids such as colored dots to indicate Higher Low (HL) or Lower High (LH) occurrences when prices pierce through a Trendline without the closing price actually breaking it. Additionally, traders can benefit from bar and background color options that offer insights into price actions relative to the trendlines.

How to Utilize the Trendline Breakout Navigator for Trading?

indicator image

Trendlines (TL), pivotal in this indicator, originate as horizontal lines from Swing Points. When a new HL for bullish TL or LH for bearish TL is identified, a connection is drawn to the initial Swing Point, forming a trendline that optimizes itself through historical close prices that breach it. The indicator is equipped with a solid-styled long-term trendline for encapsulating overall market direction, a dashed medium-term trendline to capture intermediate market movements, and a dotted short-term trendline that captures more immediate market fluctuations.

Understanding Swing Points vs. Market Trends

Swing Points initiate new trendlines. With events like "Higher High" (HH) or "Lower Low" (LL), trendlines start forming from previous Swing Highs or Lows. The indicator provides visual cues like "HH/LL" labels and optional background coloring, available for Long, Medium, or Short-term TL settings. These visual aids help traders easily spot potential trend shifts.

Color-coded backgrounds highlight market conditions:

  • Green: Triggered when prices break above bearish trendlines or at new HH occurrences.
  • Red: Activated when prices fall below bullish trendlines or during LL events.

indicator image

Bar Color Dynamics

Bar colors in this indicator depend significantly on how closing prices relate to the three trendlines. Even when a trendline becomes unavailable (e.g., post a close price breakthrough or absence of HH/LL), the latest trendline value can influence bar color determination. Generally:

  • If the closing price is beyond the "Long Term" TL, expect varying green hues, deepening when below the "Medium Term" or "Short Term" TLs.
  • Conversely, if closing prices are under the "Long Term" TL, anticipate varied red hues which grow richer when above the "Medium Term" and "Short Term" TLs.

indicator image

As illustrated above (considering solely the Long-Term TL), a reference white line (external) illustrates each bar's TL value effect on bar colors.

indicator image

The blend of trendlines, dots, and bar colors provides profound insights into underlying trends.

Analysis Through Tested Trendlines

indicator image

If a fresh HL or LH pierces a Trendline without an accompanying close price breakthrough, the Trendline sees an update. The exact point of price exceeding the Trendline is marked by dots – blue for bullish Trendlines and orange for bearish ones.

Such dots can serve as potential indicators of trend continuations or reversals.

indicator image

Visualize Higher TimeFrame Trendlines

indicator image

Users can visualize higher timeframe trendlines via the "Period" settings, allowing for trendline depiction of up to 5000 bars in magnitude.

Technical Insights and Settings

indicator image

Initially, when a trendline is drawn, a preliminary line forms. This line undergoes examination for possible historical close price breakthroughs — above for bearish TL and below for bullish TL.

Subsequently, the indicator selects the most valid intermediate point as the Trendline's inception.

indicator image

Settings Menu Overview

  • Period: Choose "chart" for trendlines reflecting the current chart timeframe or select a higher timeframe for broader trend recognition.

Swing Length Control

  • Activate swinging and define Swing Length across three trendlines to influence swing detection duration — longer values yield long-term Swing Levels.

Styling Options

  • Configure Trendline colors for both bullish and bearish scenarios.

  • Modify Wick Dot colors to represent bullish/bearish trendline tests.

  • Term: Define view between Long, Medium, or Short-term

  • HH/LL Labeling: Opt to show HH/LL labels, with/without previous Swing High/Low for selected term.

  • Background Coloring: Green if closing prices sit above selected trendline; Red otherwise.

  • Bar Coloring

Frequently Asked Questions (FAQ)

Q: How do I access the Trendline Breakout Navigator indicator?
A: You can get access on the LuxAlgo Library for charting platforms like TradingView, MetaTrader (MT4/MT5), and NinjaTrader for free.

Use this robust tool to refine your trading strategy by aligning with these dynamic trendlines and bolstering your trading objectives.

Free indicator

Get free access to this indicator on the platforms below.

TradingView
NinjaTrader
MetaTrader 4/5

Unlock the entire LuxAlgo Library

Every indicator, every strategy, full charts, and complete access to Quant — our AI agent.