Market Structure & Scatter Dashboard
 By LuxAlgoJul 31, 2026
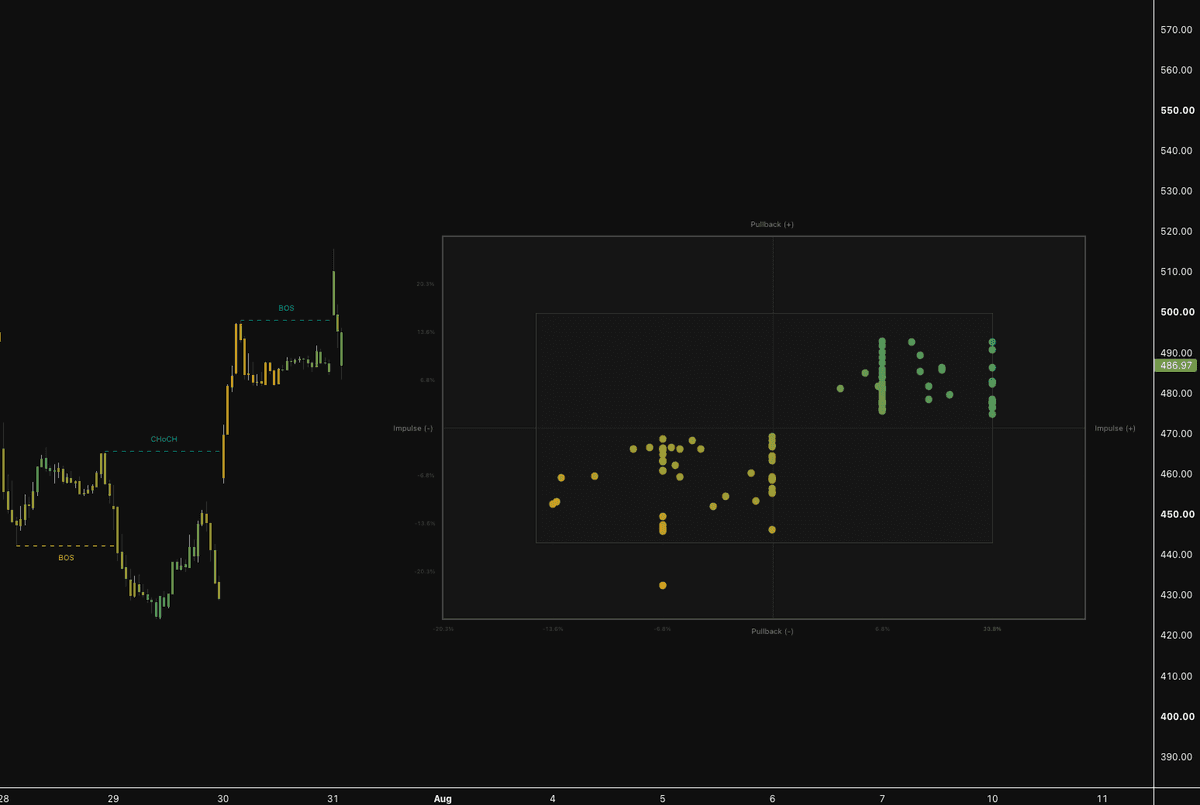

Market Structure & Scatter Dashboard measures what structure traders usually eyeball. It detects structural swing points via a pivot length, prints the appropriate label when price breaks one, then computes the percentage size of every impulse and the pullback that follows, projecting each pair onto a scatter dashboard where expansion and retracement can be compared at a glance.
How to Trade the Market Structure & Scatter Dashboard?
- Structure labels: a BOS confirms continuation through a prior swing; a CHoCH suggests a potential reversal is in progress.
- Quadrant reading: upper-right points map strong bullish impulses with their pullbacks; lower-left points chart the bearish equivalents.
- Magnitude colors: point coloring by relative size makes overextended moves and shifting momentum stand out from routine rotation.
- Heatmap mode: candles tinted by the live impulse and pullback scores show whether conditions are high-momentum expansion or deep retracement relative to recent structure.
Every confirmed swing sequence contributes one point (impulse strength on the X-axis, pullback depth on the Y-axis), and an alternating comparison of consecutive highs and lows keeps the pairs consistent, so the cloud reflects trend character rather than sampling noise.
Market Structure & Scatter Dashboard Settings
- Pivot Length: bars used to detect swing highs and lows; higher values isolate more significant, long-term structures.
- Color Candles via Scatter Heatmap and Heatmap Mode: enable candle coloring and choose combined, impulse-only, or pullback-only scoring.
- Bullish Color / Bearish Color: the colors applied to structure breaks and momentum signals.
- Dashboard Vertical Position, Dashboard Time Offset, Dashboard Size Scale: anchor the panel, project it clear of price, and scale it to your layout.
Frequently Asked Questions
Free indicator
Get free access to this indicator on the platforms below.

The Library is free. Quant makes it yours.
Pull any concept or indicator into Quant: rebuild it, retune it, or turn it into a backtested strategy of your own.