MSS Sweeps
 By LuxAlgoAug 12, 2026
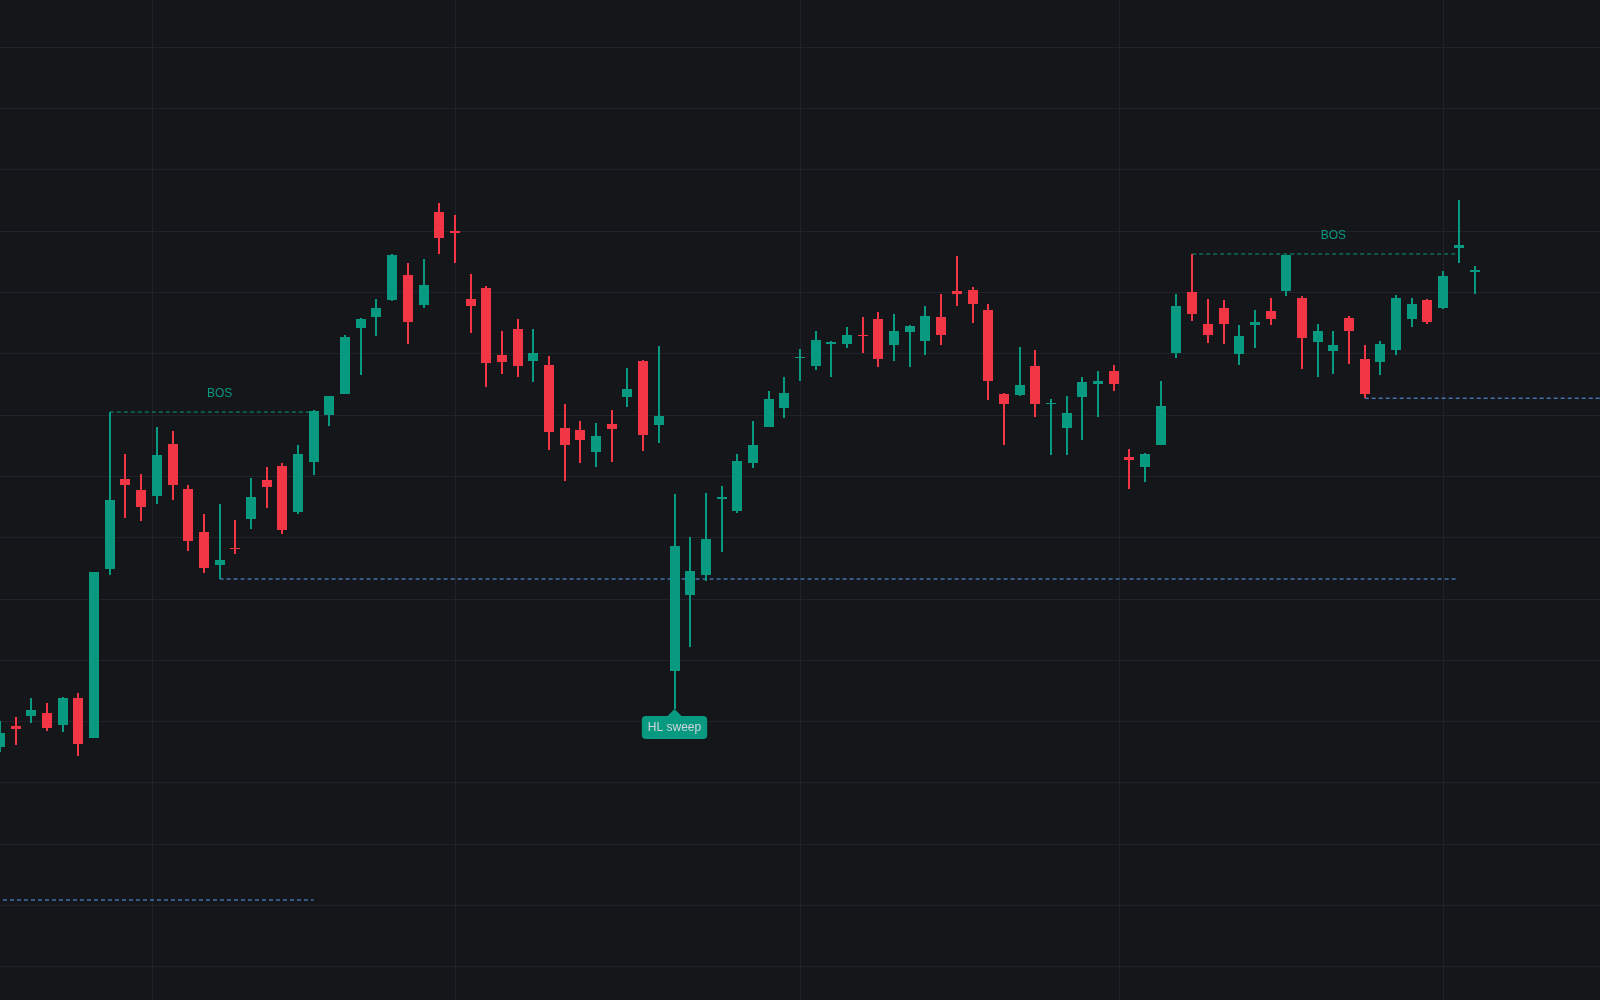

MSS Sweeps is a specialized technical analysis tool designed to identify market structure shifts and liquidity sweeps by monitoring internal price action. By tracking internal pivots and structure breaks, the indicator provides traders with a clearer view of trend continuation and potential reversal points. It highlights protected levels following a Break of Structure, offering precise insights into when institutional liquidity might be tapped and subsequently reclaimed, allowing users to make more informed decisions based on refined price action mechanics.
How to Trade the MSS Sweeps?
Trading with the MSS Sweeps indicator centers on identifying the relationship between market structure and liquidity. The tool identifies a Break of Structure (BOS) when price effectively moves past a significant internal high or low, signaling a confirmed trend. Once a BOS is established, the indicator creates a protected level that represents a key support or resistance zone.
When the price dips below a protected higher low or rises above a protected lower high, it is often seen as a liquidity sweep. A valid sweep signal occurs when the price breaches this level but quickly reclaims it before the candle closes. This "sweep and reclaim" behavior can indicate that institutional orders are being filled, often serving as a catalyst for a move in the original trend direction. Traders typically watch for these specific sweeps as high probability entry opportunities. Because the indicator filters these signals to show only the first touch of a protected level, it helps maintain a clean chart, allowing you to focus on the most impactful structural interactions rather than noise.
MSS Sweeps Settings
Internal Structure
- Internal structure length: Sets the number of bars used to calculate pivots. A lower value is more sensitive to recent price action, while a higher value focuses on more significant structural pivots.
- Confluence filter: Enables an additional requirement for structure breaks, ensuring that a breakout candle meets specific criteria to validate the movement.
Display
- Show BOS labels: Toggles the display of Break of Structure labels that occur following a valid trend change.
- Show CHOCH labels: Enables the display of Change of Character labels, which identify the initial market shift against the previous trend.
- Show MSS sweeps: Controls the visibility of label markers when a price sweep is identified at a protected level.
- Show protected level: Toggles the horizontal lines that extend from the most recent BOS, visually marking the current protected zone.
Style
- Bullish/Bearish color: Customizes the colors used for structural breaks and sweep signals in bullish and bearish trends.
- Protected level color: Sets the color for the horizontal lines marking the current protected high or low.
Frequently Asked Questions
Free indicator
Get free access to this indicator on the platforms below.

The Library is free. Quant makes it yours.
Pull any concept or indicator into Quant: rebuild it, retune it, or turn it into a backtested strategy of your own.