All indicators

On-Chain Signals

By LuxAlgoAug 6, 2025

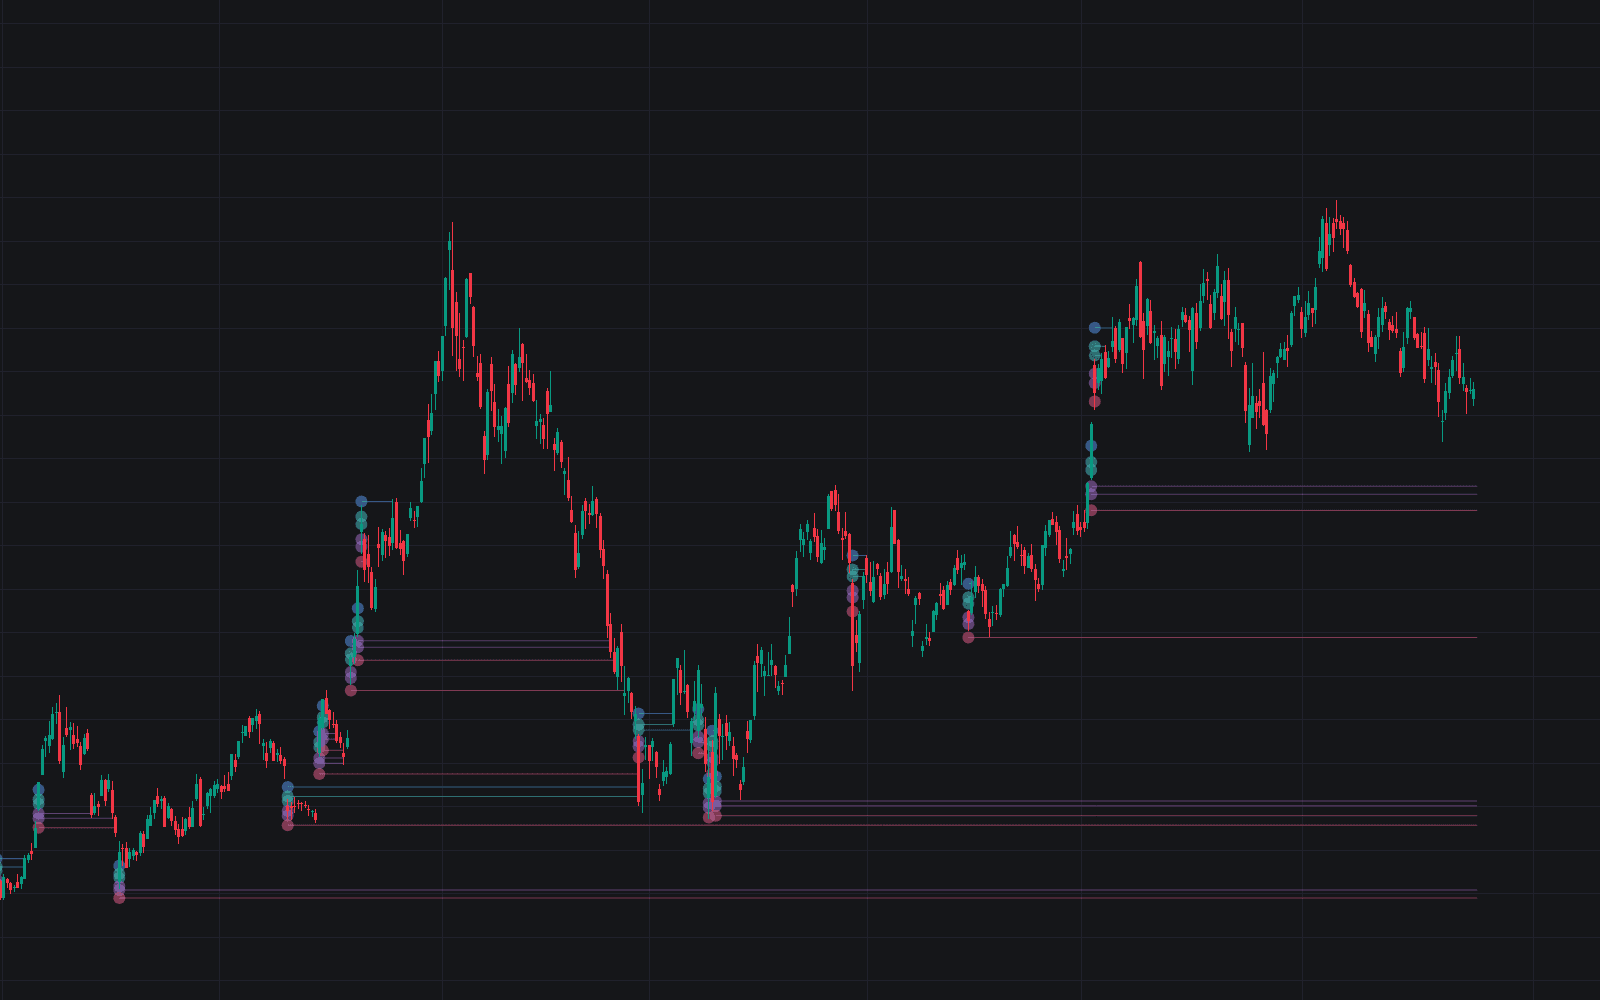
Static chart image
Dynamic OverlaysSignalsDashboard

The On-Chain Signals trading indicator is designed for crypto traders who want a deeper, data-driven understanding of market sentiment. By leveraging IntoTheBlock's blockchain analytics, this tool delivers four powerful signals—Net Network Growth, In the Money, Concentration, and Large Transactions—to help traders determine whether the market is showing a bullish, bearish, or neutral bias.

Unlike standard price-based indicators, this script taps into real blockchain fundamentals to give a more objective and leading view of crypto price behavior. Traders can visualize these signals using multiple modes—gauge, historical plots, or moving averages—making it easy to adapt to different trading styles and strategies.

How to Trade with the On-Chain Signals Indicator?

indicator image

This trading strategy works by analyzing the four on-chain metrics simultaneously. Each signal outputs a bullish, bearish, or neutral state, and the combined result forms the overall market bias:

  • Bullish – More bullish signals than bearish
  • Bearish – More bearish signals than bullish
  • Neutral – Equal bullish and bearish signals

With this bias, traders can anticipate potential price moves:

  • A bullish bias may suggest a stronger chance of price appreciation.
  • A bearish bias could point to likely downside movements.
  • A neutral bias often indicates sideways consolidation or indecision.

For best results, apply this indicator to a daily timeframe, as the on-chain data updates and provides the most reliable directional insights there.

Understanding the Four Blockchain Signals

  • Net Network Growth – Measures changes in the total number of wallet addresses. A growing number of addresses signals healthy adoption and potential bullishness.
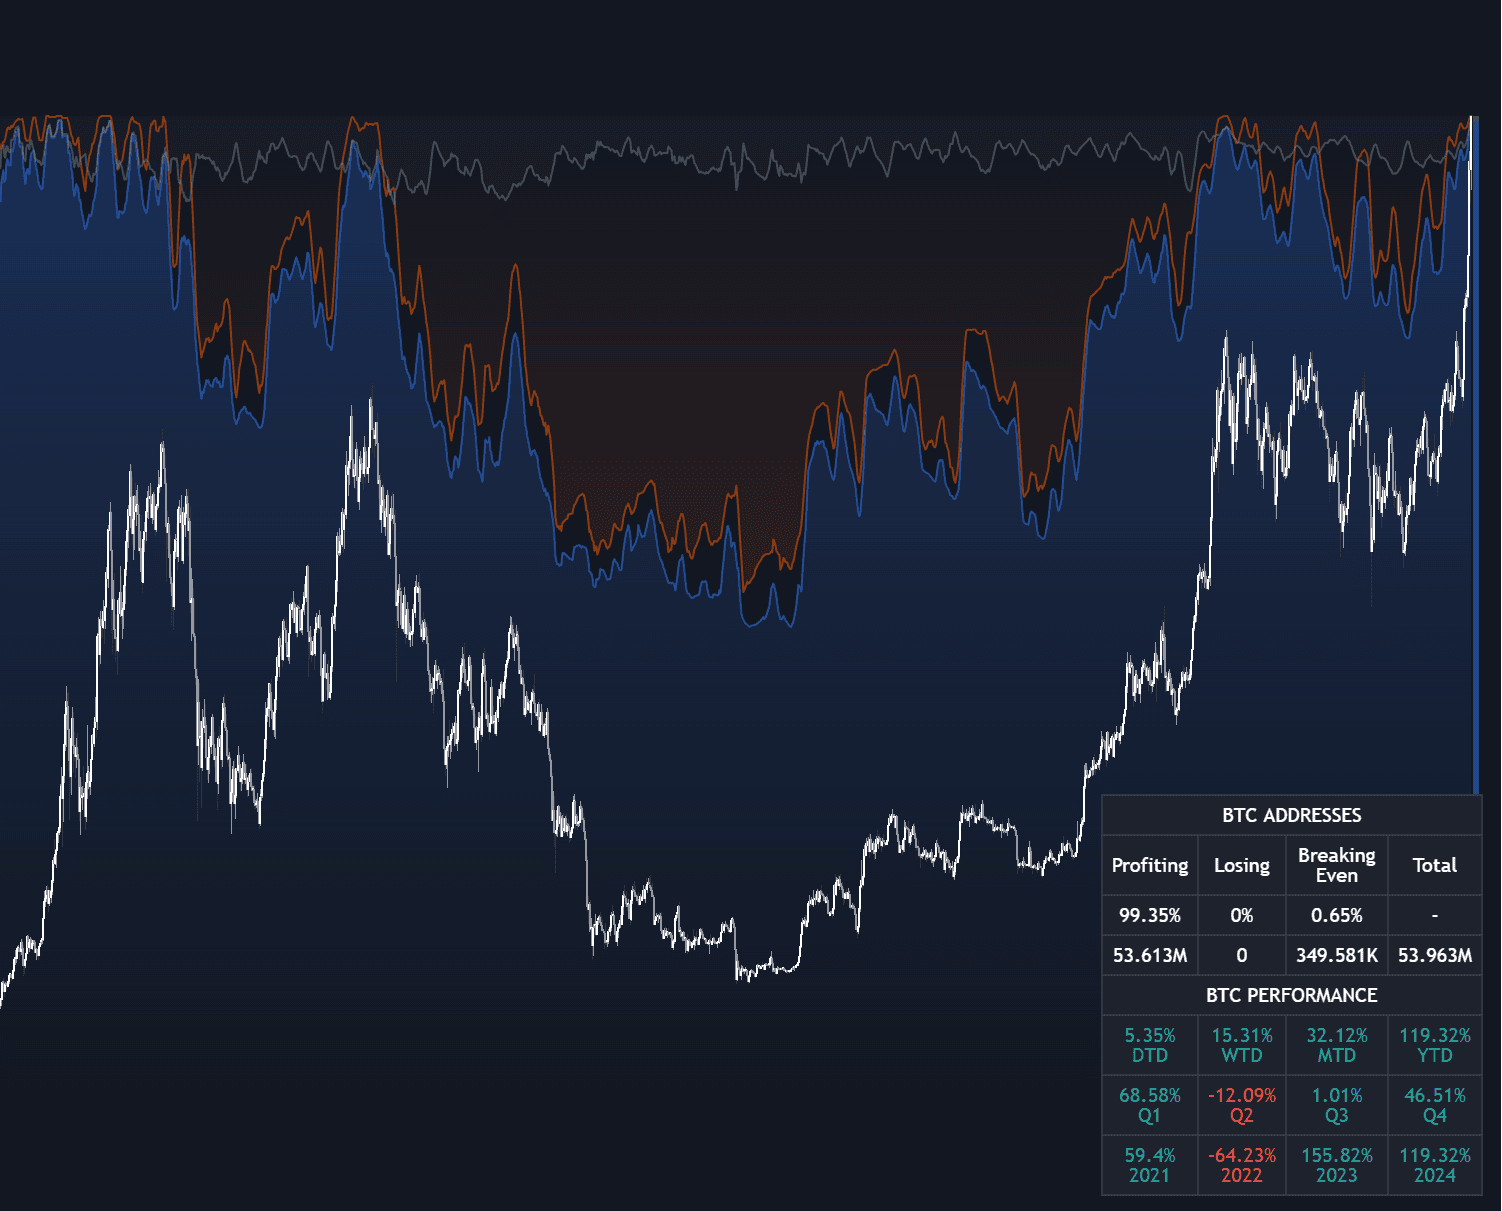
  • In the Money – Tracks the percentage of addresses that are currently profitable. Rising profitability often strengthens market sentiment.
  • Concentration – Evaluates how much supply is held by large investors (whales). High concentration can increase volatility but may also signal strong hands supporting price.
  • Large Transactions – Monitors transactions above $100,000 and compares them to 21- and 30-day moving averages, revealing the momentum of significant capital flows.

When combined, these metrics deliver a multi-dimensional technical and fundamental trading signal that goes beyond typical chart indicators.

Display Modes for Flexible Market Analysis

indicator image

Traders can choose how to visualize the signals:

  • Gauge (Default) – Provides an at-a-glance reading of the current bias with customizable size, scale, and colors.
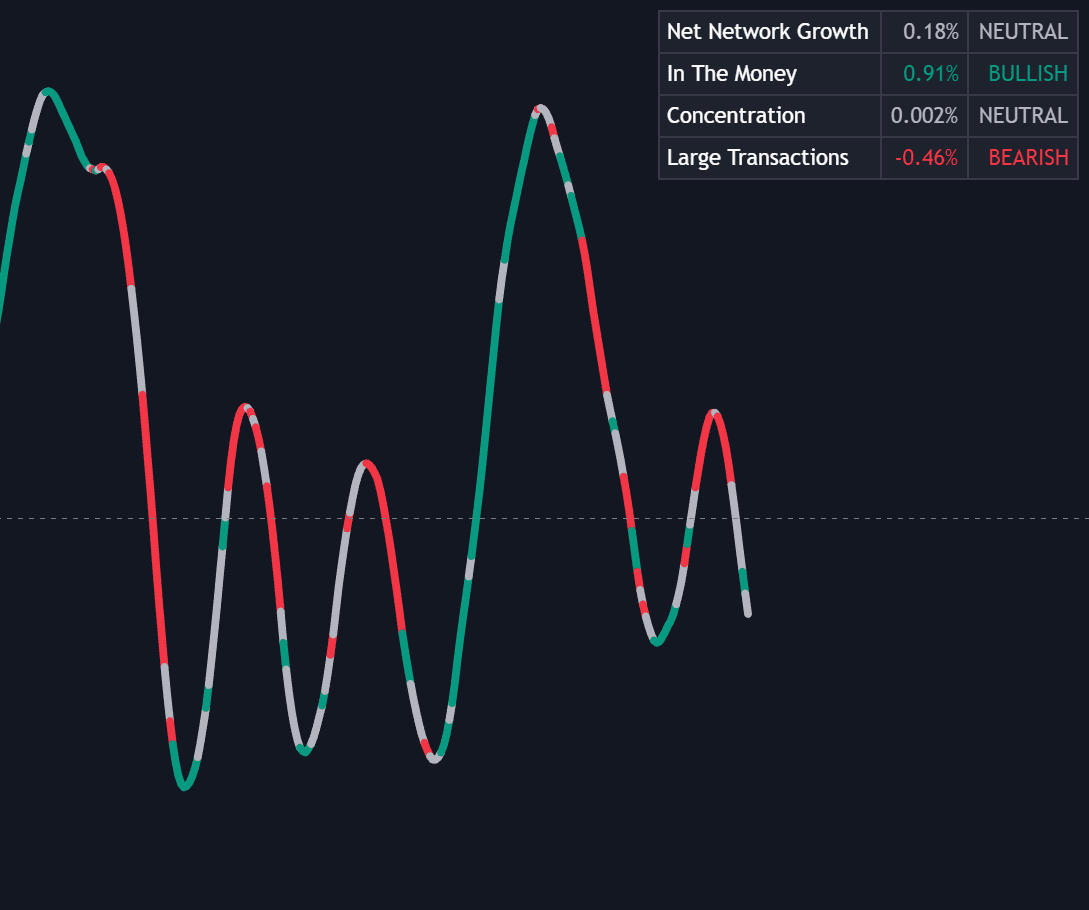
  • Historical Data – Plots each of the four signals over time, helping traders fine-tune thresholds and study past market reactions.
  • Average – Smooths the overall bias (bullish = +1, neutral = 0, bearish = -1) using moving averages to observe longer-term market sentiment shifts.

Indicator Settings and Customization

Fine-tune the On-Chain Signals indicator to match your trading style:

  • Display Mode – Switch between gauge, historical plots, or average.
  • Average Settings – Choose smoothing type (triangular, simple, exponential) and period length.
  • Thresholds – Define bullish and bearish levels for each of the four signals.
  • Dashboard – Enable/disable a compact dashboard, adjust position and size.
  • Gauge Customization – Scale the gauge, toggle curved display, and set color schemes.
  • Style Options – Toggle visibility and colors for each historical signal plot.

Technical Details Behind the Signals

The indicator computes its signals from IntoTheBlock's datasets as follows:

  • Net Network Growth
float netNetworkGrowthData = customData('_TOTALADDRESSES')
float netNetworkGrowth = 100 * (netNetworkGrowthData[1] / netNetworkGrowthData[8] - 1)
  • In the Money
float inTheMoneyData = customData('_INOUTMONEYIN')
float averageBalance = customData('_AVGBALANCE')
float inTheMoneyBalance = inTheMoneyData * averageBalance
float sma = ta.sma(inTheMoneyBalance, 7)
float inTheMoney = ta.roc(sma, 1)
  • Concentration
float whalesData = customData('_WHALESPERCENTAGE')
float inverstorsData = customData('_INVESTORSPERCENTAGE')
float bigHands = whalesData + inverstorsData
float concentration = ta.change(bigHands[1]) * 100
  • Large Transactions
float largeTransacionsData = customData('_LARGETXCOUNT')
float largeTX21 = ta.ema(largeTransacionsData, 21)[1]
float largeTX30 = ta.ema(largeTransacionsData, 30)[1]
float largeTransacions = ((largeTX21 - largeTX30) / largeTX30) * 100

By analyzing these metrics dynamically, traders get a real-time, blockchain-backed signal that aligns with major market movements.

FAQ

Q: What does the On-Chain Signals indicator do?
A: It combines four fundamental blockchain metrics to provide a bullish, bearish, or neutral bias for cryptocurrencies, helping traders anticipate price movements.

Q: Which timeframe is best for using this indicator?
A: The daily timeframe provides the most reliable results due to how on-chain data updates.

Q: Can I customize the thresholds and visuals?
A: Yes, traders can fully adjust thresholds, smoothing methods, gauge size, dashboard position, and colors to suit their strategy.

Q: How can I access the On-Chain Signals indicator?
A: You can get access to the On-Chain Signals indicator for free on the LuxAlgo Library, available for popular charting platforms like TradingView, MetaTrader (MT4/MT5), and NinjaTrader.

Free indicator

Get free access to this indicator on the platforms below.

TradingView
NinjaTrader
MetaTrader 4/5

Unlock the entire LuxAlgo Library

Every indicator, every strategy, full charts, and complete access to Quant — our AI agent.