Concept
On-chain Valuation Suite
On-chain Valuation Suite, also known as realized cap, HODL waves, dormancy, Puell Multiple, is a Breadth, Sentiment & External Data concept. The Library holds 3 implementations, each one a working definition you can pull into Quant.
Top On-chain Valuation Suite indicators
The top custom implementations, built on the original standard On-chain Valuation Suite formula.
3 total
Want to trade On-chain Valuation Suite? Any of the 3 implementations below is one prompt away from a backtested strategy in Quant.
What is the On-chain Valuation Suite?
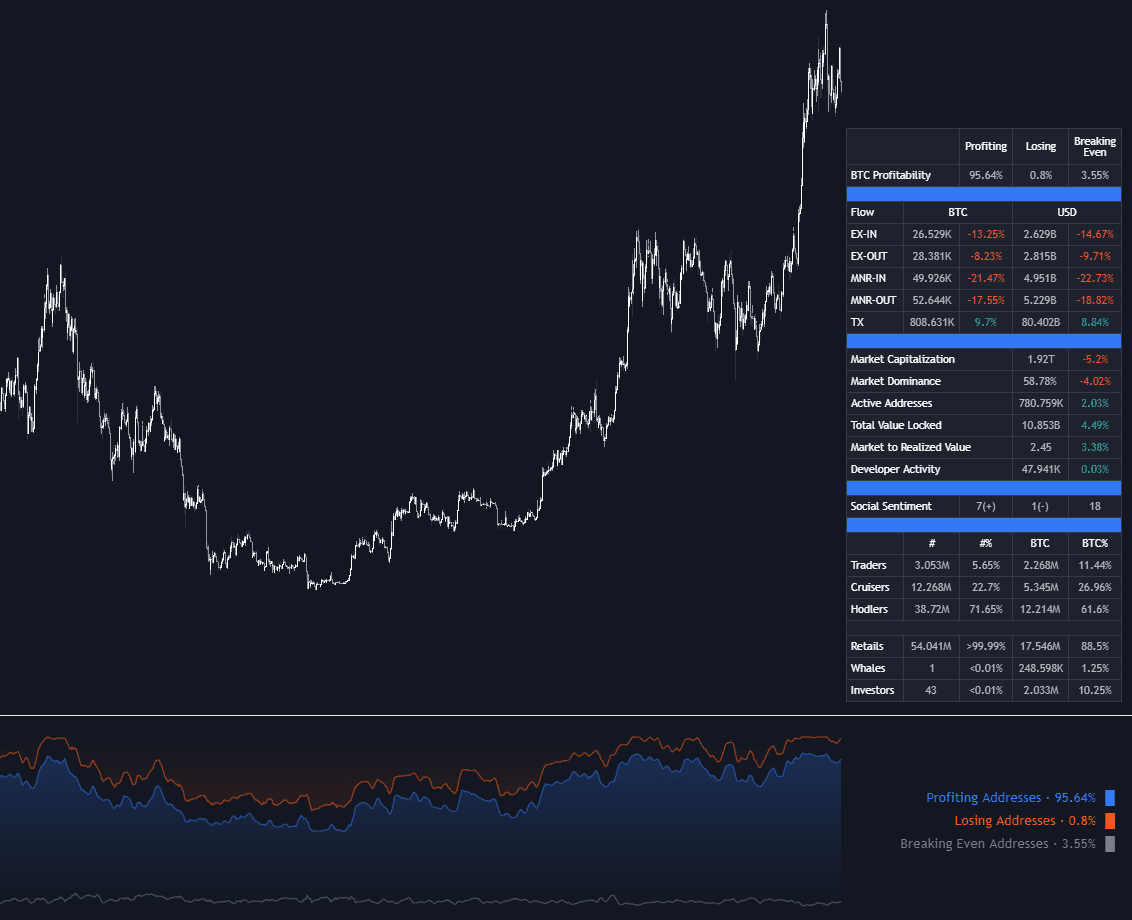
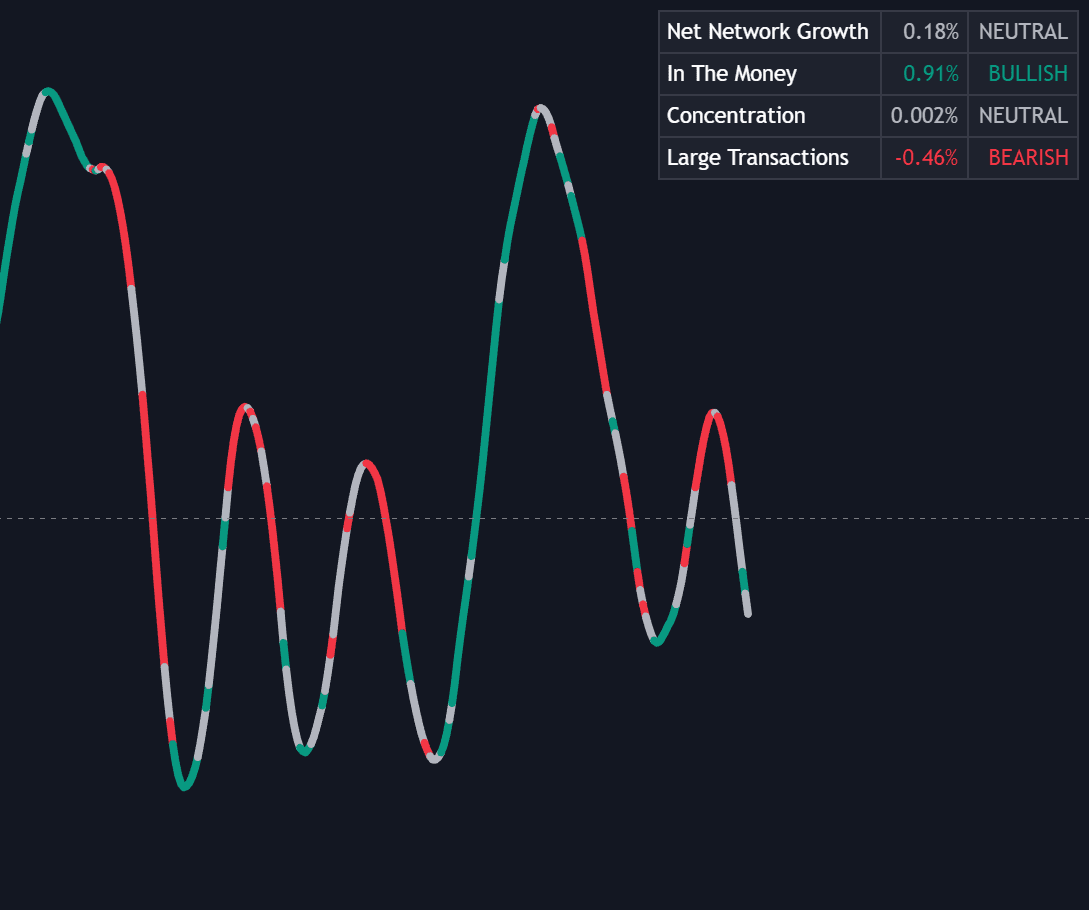
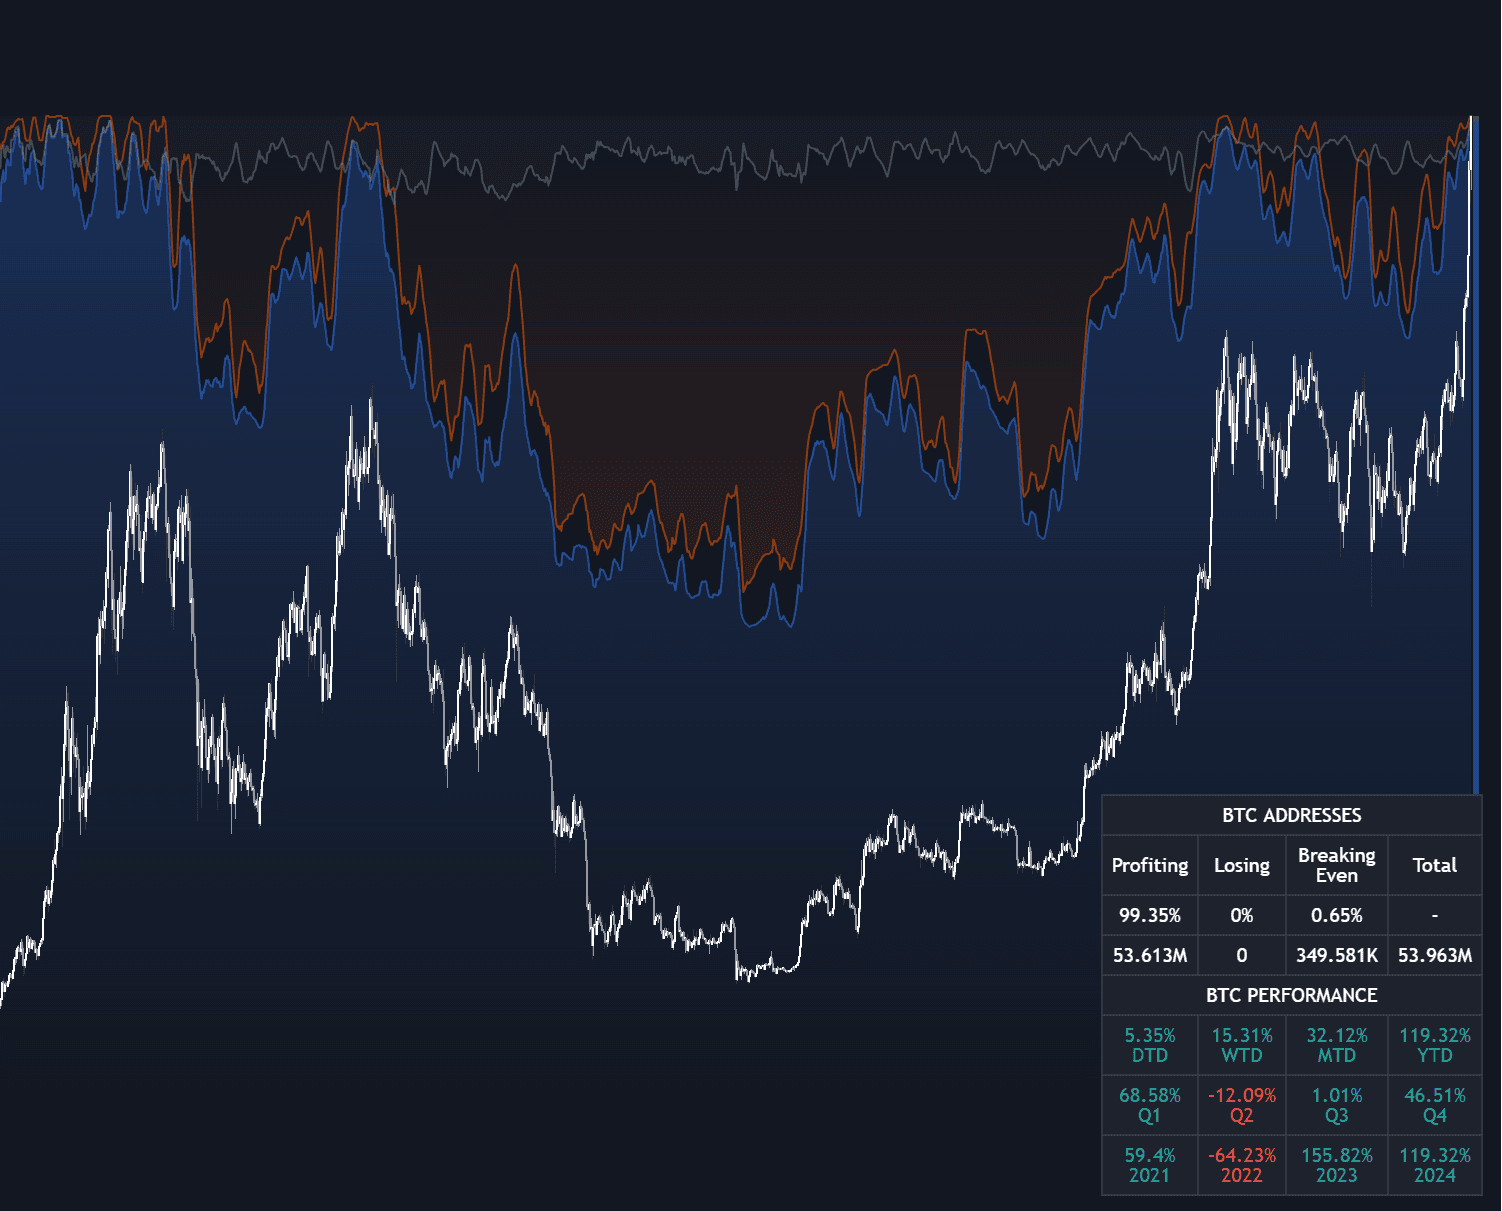
The on-chain valuation suite is the family of metrics that values a crypto asset from its own blockchain data rather than from price action alone. Because every on-chain transaction is public, analysts can reconstruct an aggregate cost basis and watch how supply behaves. Realized cap values each coin at the price when it last moved on-chain, producing the cost-basis denominator behind ratios such as MVRV (market value to realized value); the same last-moved pricing supplies the cost basis in spent-output measures such as SOPR, the spent output profit ratio. HODL waves bucket circulating supply by how long each coin has sat unmoved. Dormancy divides coin days destroyed by transfer volume, showing the average age of the coins being spent.
The suite grew out of more than a decade of open research on Bitcoin's public ledger. Coin days destroyed, the raw ingredient behind dormancy, was proposed on the Bitcointalk forum in 2011. Realized cap was formalized in 2018 by Nic Carter and Antoine Le Calvez of Coin Metrics, and HODL waves were introduced the same year by Dhruv Bansal of Unchained Capital. On the miner side, the Puell Multiple is named for analyst David Puell, and hash ribbons were published by Charles Edwards in 2019. The shared premise is that a transparent ledger lets anyone audit holder cost basis and miner economics directly.
A second branch tracks miners, the network's structural sellers. The Puell Multiple divides the daily dollar value of newly issued coins by its one-year moving average to flag revenue extremes, and hash ribbons compare short and long moving averages of network hash rate (commonly 30- and 60-day) to date miner capitulation and recovery. These are slow, cycle-scale tools: they describe where supply and its holders sit, and they say little about the next week.
Within a sentiment toolkit the suite plays the role that advance/decline internals play in equities: a read on participation and positioning beneath the price. Where open interest and funding describe leveraged derivatives traders, on-chain metrics describe spot holders, and the two regularly disagree in informative ways.
How to read on-chain valuation metrics on a chart
These series load from blockchain data providers as separate panels or overlays, usually on daily and weekly charts.
- 1Plot market cap against realized cap, or their ratio: stretches far above the realized-price baseline accompanied past cycle peaks, while past bear-market lows formed below it.
- 2Add HODL waves and watch the oldest bands: swelling one-year-plus bands mean supply is aging in wallets, while old bands shrinking into a rally mean long-term holders are distributing.
- 3Check dormancy or coin days destroyed for spikes: a burst of very old coins moving into strength is often early-holder selling rather than new demand, though custody reshuffles can fire the same signal.
- 4Overlay the Puell Multiple and mark its historical extremes: readings far above the baseline flag windfall miner revenue, far below it flag revenue stress.
- 5Track the hash-ribbon averages: the 30-day crossing under the 60-day dates miner capitulation, and the cross back above it dates recovery.
How it's calculated
A family of Bitcoin valuation metrics built from what coins were worth when they last moved, how long they stay dormant, and what miners earn.
Realized Cap prices each coin at its last move, so MVRV above 1 means the average coin is held in profit.
Provider conventions differ (filtering self-transfers, exchange internals), so values vary between Glassnode, Coin Metrics and others.
Hash Ribbons is Charles Edwards' construction; the full strategy adds price-recovery filters before signaling.
How traders use it
- As cycle context: realized-cap ratios and long-term holder behavior are read alongside crypto cycle models to judge whether a market sits closer to accumulation or euphoria, with the caveat that only a handful of past cycles exist to calibrate against.
- As a supply-behavior read: expanding old-coin HODL bands with low dormancy suggest holders are sitting tight, while rising dormancy into a rally shows aged coins being spent into strength.
- As a miner-stress signal: a Puell Multiple collapse or a hash-ribbon capitulation cross flags miner stress and potential forced selling, and the later recovery cross is the event many frameworks actually wait for.
- As confluence with flow data: falling exchange balances alongside expanding old-coin bands strengthen an accumulation read, so the suite is read next to exchange and stablecoin flows.
- As allocation context: cycle reads from the suite are set beside ratio charts such as Bitcoin dominance to judge where in the crypto stack risk belongs at that point in the cycle.
On-chain valuation vs related concepts
Exchange & Stablecoin Flows: Flows capture coins moving toward or away from venues where they can be sold, a here-and-now signal; the suite captures the standing state of supply: cost basis, age, miner economics. Flows ask whether sell-side fuel is arriving; the suite asks who owns the coins and at what price.
Open Interest: Open interest measures outstanding derivatives exposure that a margin engine can force to close; on-chain metrics measure spot holdings that cannot be liquidated out from under their owners. A move on surging open interest while dormant supply stays put is leverage-led, which shapes how it unwinds.
Crypto Cycle Models: Cycle models are forecasting frameworks, halving clocks and regression bands among them, that often take realized cap or holder-age data as inputs. The valuation suite is the measurement layer underneath: descriptive rather than predictive.
Concept family
Breadth, Sentiment & External Data
63 concepts mapped · 63 in the Library
On-chain Valuation Suite FAQ
Turn On-chain Valuation Suite into a trading strategy.
Take any implementation from this page into Quant, then build on it, backtest it on real data, and keep refining it in conversation.