On-Chain Analysis
 By LuxAlgoJan 8, 2025
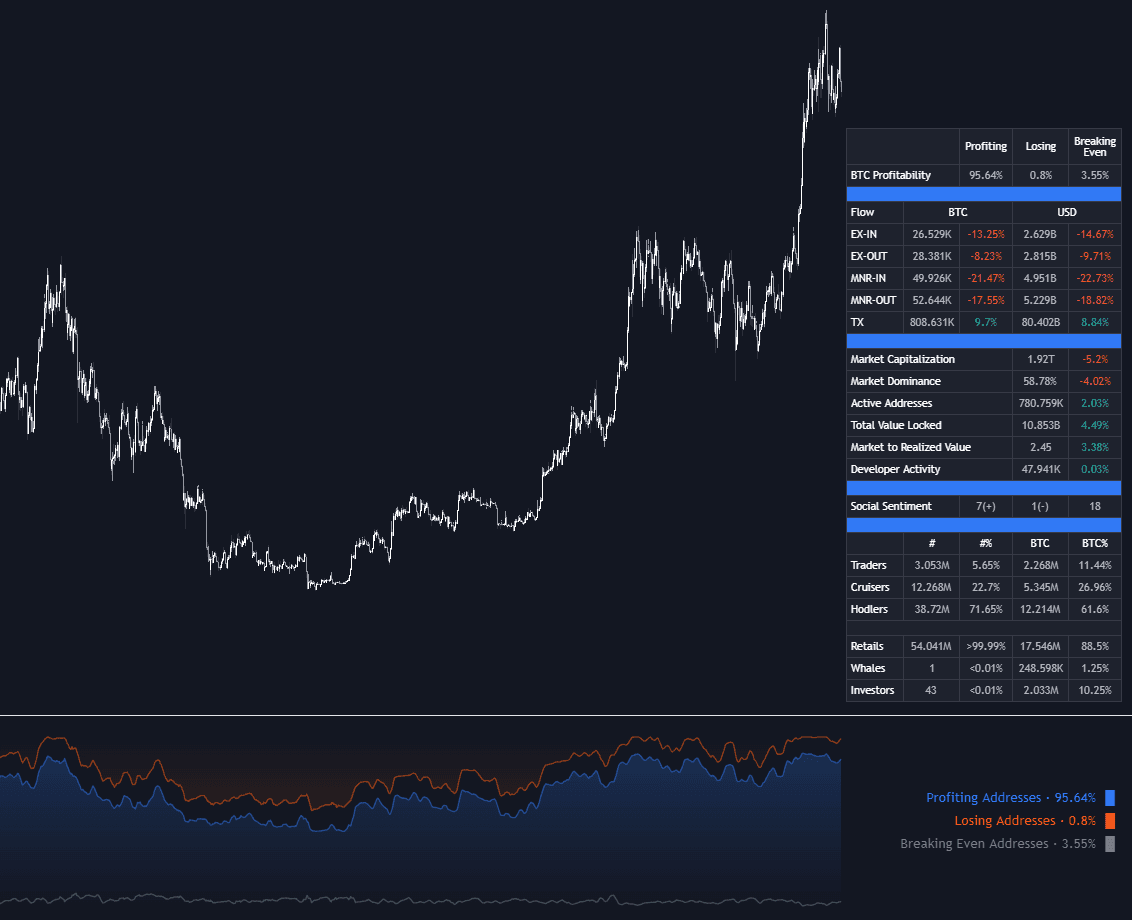
On-Chain Analysis puts the blockchain's own ledger beneath your crypto chart, drawing on the on-chain valuation suite rather than price alone. Pick one metric at a time (wallet profitability, exchange or miner flow, on-chain volume, large buyers and sellers, market capitalization and dominance, active addresses, total value locked, MVRV, developer activity, social sentiment, or holder composition) and study network reality next to the tape.
How to Trade the On-Chain Analysis?
- Wallet profitability and social sentiment: read the crowd's mood and anticipate where profit-taking pressure may build.
- Exchange flows and miner flows: heavy inflows can precede selling pressure, sustained outflows lean toward accumulation, and quiet miner wallets signal confidence.
- On-chain volume and active addresses: gauge genuine network usage and adoption behind the ticker.
- Holder composition: whale-concentrated supply predisposes a market to sharp moves, institutional weight suggests longer-horizon conviction, and heavy retail participation tends to add volatility.
A smoothing input and an optional signal line turn raw series into readable trends and crossovers, while the on-chart dashboard keeps headline statistics in view. One practical caveat carries over from the data itself: on-chain coverage can be restricted for certain cryptocurrencies.
On-Chain Analysis Settings
- On-Chain Data: selects which metric is plotted, from Wallet Profitability through Exchange Flow and beyond.
- Smoothing: tempers the raw series for trend clarity.
- Signal Line: SMA, EMA, or RMA with an adjustable length, or none at all.
- On-Chain Stats and Dashboard: toggle the statistics display and set its size, position, and colors.
Frequently Asked Questions
Free indicator
Get free access to this indicator on the platforms below.

The Library is free. Quant makes it yours.
Pull any concept or indicator into Quant: rebuild it, retune it, or turn it into a backtested strategy of your own.