Random Walk Index
 By LuxAlgoMay 22, 2026
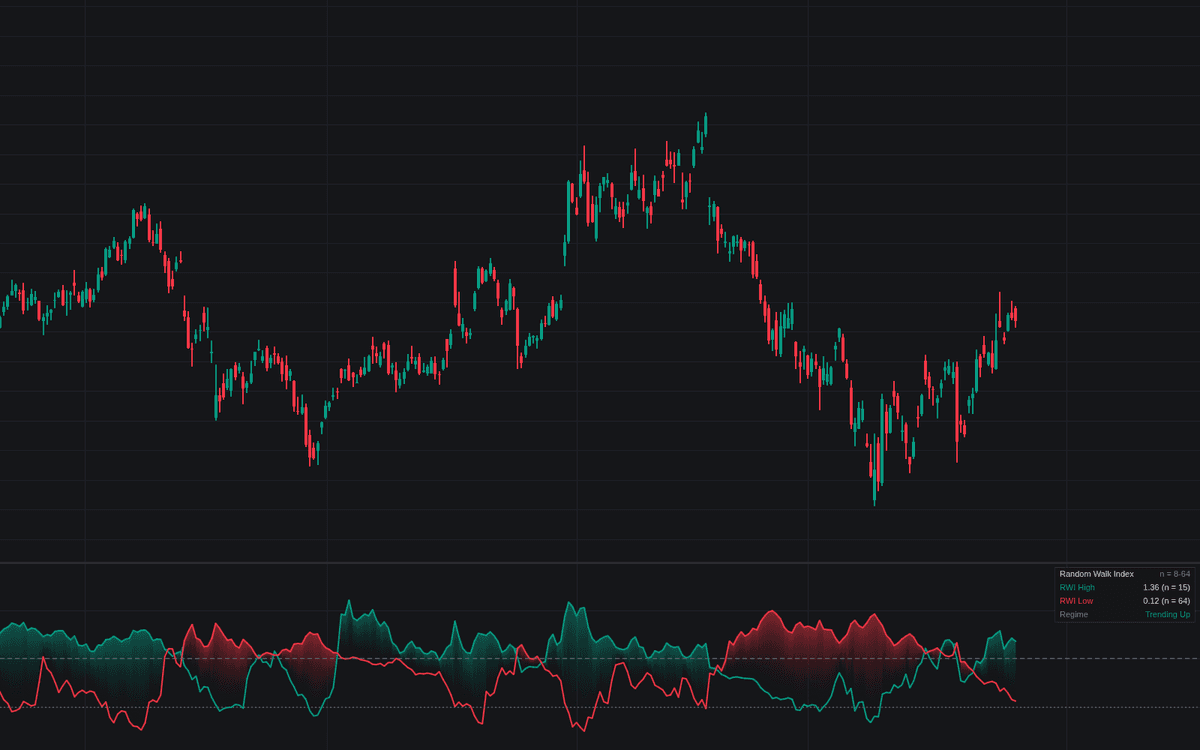

Random Walk Index tests every move against the displacement pure noise would have produced. Each bar, the build scans lookbacks between the configured bounds, computes the Random Walk Index of highs and of lows at every horizon (ground covered divided by ATR × √n) and keeps each line's maximum, so RWI High and RWI Low each speak from whichever horizon is hardest to dismiss as noise. A dashed benchmark line, a dominance gradient and a dashboard pairing each reading with its lookback (n) and regime call complete the pane.
How to Trade the Random Walk Index?
- RWI High above the threshold: upward travel larger than a random walk explains. The regime reads Trending Up while it leads, alerted as Uptrend Confirmed; RWI Low mirrors the logic.
- Both lines below the threshold: displacement consistent with noise. The Random Walk Regime alert marks the shift, a cue to trade the range or step back.
- Filtered crossovers: one line overtaking the other above the threshold prints optional circles, alerted both ways; sub-threshold crossings are ignored.
- Exhaustion checks: a declining RWI peak at a new price extreme draws a dashed line and label when enabled, alerted even with drawings hidden.
Random Walk Index Settings
- Minimum Lookback (default 8) and Maximum Lookback (default 64): bounds of the scan; equal values fix one horizon.
- Random Walk Threshold (default 1.0): the benchmark anchoring regime events and filtering crossovers.
- Show Exhaustion Checks (default off) with Peak Pivot Length (default 5) and Max Peak Distance (default 80): drawings, peak confirmation, and max spacing between paired peaks.
- Show Dashboard (on) with Location (Top Right) and Size (Small); Crossover Markers (off), Gradient Fill (on).
Frequently Asked Questions

Original indicatorBuilt in-house by LuxAlgo
The Library is free. Quant makes it yours.
Pull any concept or indicator into Quant: rebuild it, retune it, or turn it into a backtested strategy of your own.