Concept
Random Walk Index
Random Walk Index is a Trend concept. The Library holds 1 implementation, a working definition you can pull into Quant.
Top Random Walk Index indicator
The top custom implementation, built on the original standard Random Walk Index formula.
1 total
The Random Walk Index implementation below can become a backtested trading strategy — describe your rules and Quant writes the code.
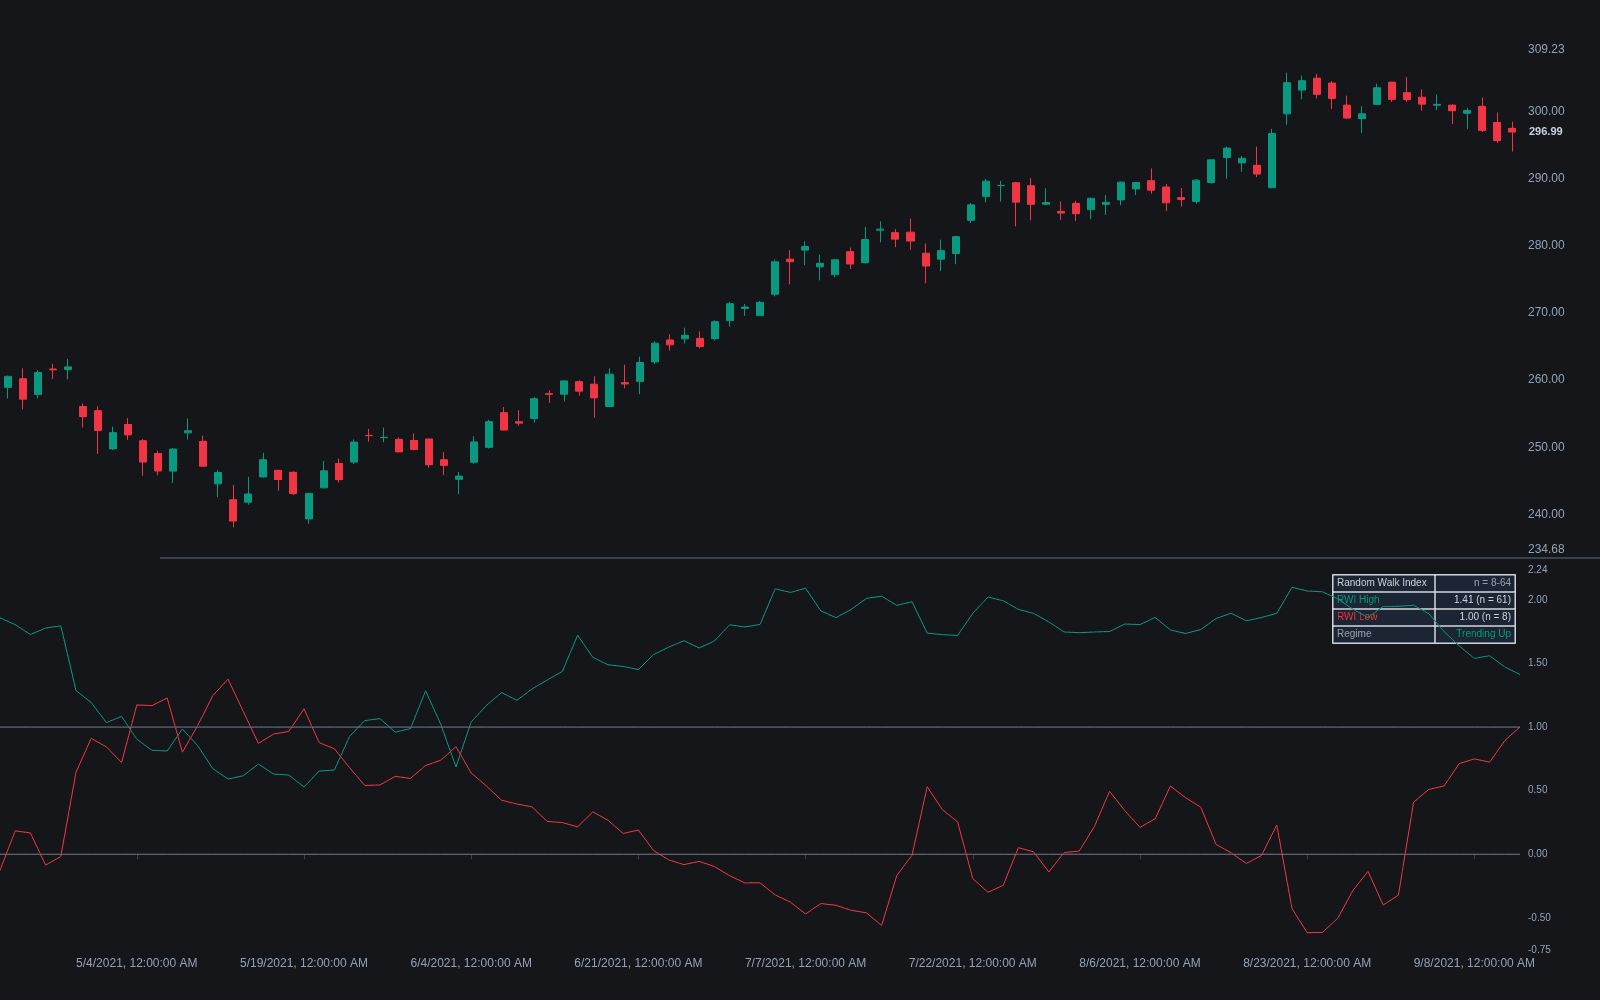
What is the Random Walk Index?
The Random Walk Index (RWI) asks a blunt statistical question of every price move: did price travel further than a random walk would have? In a pure random walk, expected displacement grows with the square root of elapsed time, not linearly. The RWI therefore compares the actual range price has covered over a lookback with the displacement a random walk of the same volatility would produce, using ATR as the volatility yardstick. Readings above 1 mean price has moved further than randomness alone explains, which is the working definition of a trend.
The indicator was introduced by Michael Poulos in the early 1990s and is plotted as two lines: RWI of highs, measuring how far the current high sits above a past low, and RWI of lows, measuring how far the current low sits below a past high. Each line is typically computed across a span of lookback lengths and the maximum reading kept, so the indicator finds the horizon over which the move looks least random.
Traders care because most trend tools assume a trend exists and then measure it; the RWI instead tests the trend hypothesis against a noise benchmark. That framing makes it a natural regime filter, alongside other trend/range classifiers, for deciding whether trend-following or mean-reversion logic should be active.
How it's calculated
Two lines are computed over a span of lookbacks and the maximum of each is kept.
Readings above 1 indicate displacement beyond random walk expectation; below 1 is consistent with noise.
Some implementations fix a single n instead of scanning a span; results differ mainly at trend turns.
How traders use it
- As a trend filter: when RWI of highs exceeds 1, treat the market as trending up and allow long trend-following entries; when RWI of lows exceeds 1, the downtrend case holds. Readings below 1 on both lines argue for range tactics or standing aside.
- As a crossover signal: some systems go long when RWI of highs crosses above RWI of lows and short on the reverse, usually with an added threshold so weak, sub-1 crossings are ignored.
- As an exhaustion check: an extended trend whose RWI peaks decline while price makes new extremes suggests the move is losing its non-random character, similar in spirit to momentum divergence.
- Its main limitations are lag and parameter sensitivity: the multi-lookback maximum reacts slowly at turns, short spans flag noise as trend, and long spans miss young trends. It says nothing about targets or timing, so it is best paired with an entry method rather than traded alone.
Random Walk Index vs related trend gauges
ADX / DMI system: ADX smooths directional movement to score trend strength but has no explicit statistical benchmark. The RWI is built around one: it normalizes displacement by what a random walk would achieve, so its threshold of 1 has a direct interpretation.
Choppiness Index: The Choppiness Index compares summed true range with total range to score congestion, and is direction-blind. The RWI produces separate up and down readings, so it identifies both that a trend exists and which way it points.
Vertical Horizontal Filter: The VHF divides net range by the sum of bar-to-bar changes, a path-efficiency ratio with no volatility scaling. The RWI instead benchmarks displacement against ATR times the square root of time, making it the more explicitly statistical of the two.
Concept family
Trend
100 concepts mapped · 100 in the Library
Random Walk Index FAQ
Turn Random Walk Index into a trading strategy.
Take the implementation from this page into Quant, then build on it, backtest it on real data, and keep refining it in conversation.