Signal Forge
May 25, 2026

The Signal Forge indicator is a modular trading indicator and strategy testing engine built to help traders combine multiple technical analysis filters into one unified signal system. Instead of manually checking several indicators one by one, Signal Forge lets users blend 11 different technical filters, compare their directional bias, and visually backtest how those combined signals perform directly on the chart. This makes it useful for traders who want to build, test, and refine a trading strategy based on indicator confluence, trend confirmation, and ATR-based risk management without needing to write code.
How to Trade with the Signal Forge Indicator
Signal Forge is designed around a flexible signal logic system. Traders can enable or disable individual technical indicators depending on the type of trading strategy they want to test. Once selected, the tool evaluates whether the active indicators are bullish, bearish, or neutral, then creates trading signals when the chosen logic conditions are met.
Users can choose between two main signal modes:
- Strict Mode: Requires ALL enabled indicators to align in the same direction before generating a signal.
- Any Mode: Allows ANY enabled indicator to trigger a signal when its condition is met.
Strict mode is useful for traders who want stronger confirmation and fewer signals, while any mode is better suited for traders who want more frequent opportunities and broader signal detection.
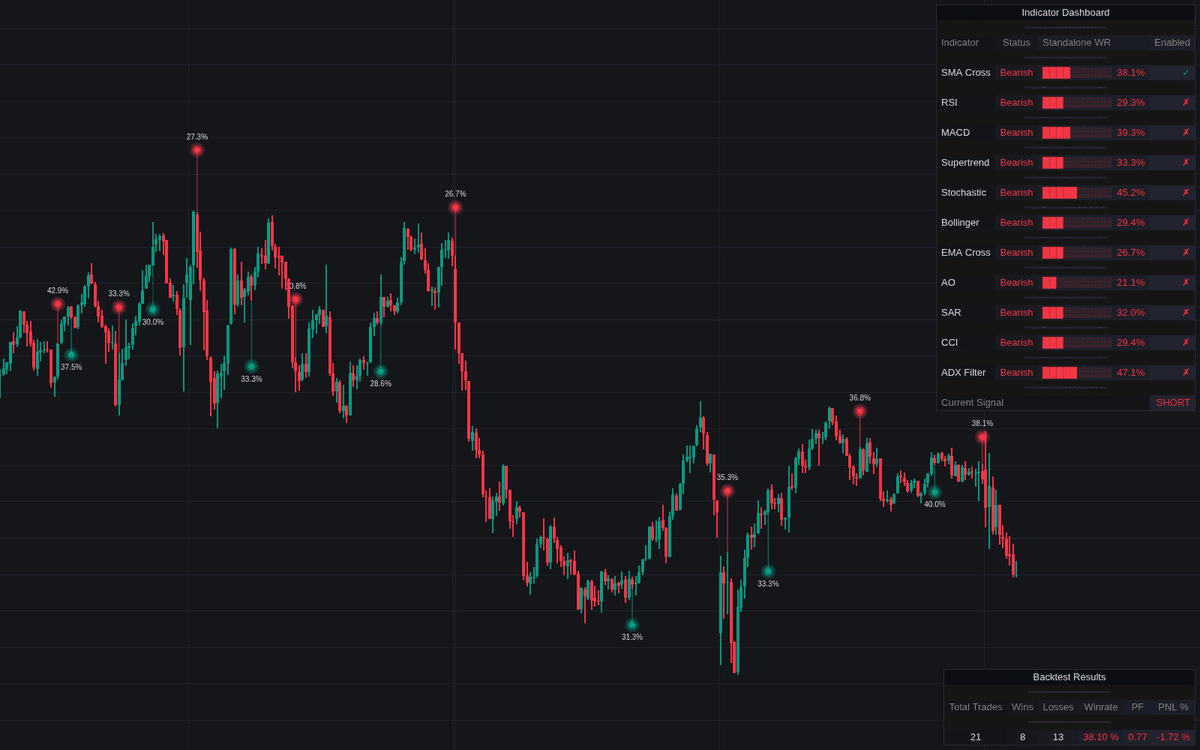
Signals appear directly on the chart as glowing orbs connected to price action. Each signal also includes a historical win rate label at the time of entry, allowing traders to visually review how the strategy was performing when each trade signal appeared. This makes Signal Forge helpful for auditing trading strategy performance over time and identifying whether certain market conditions produce stronger results.
Choosing Technical Indicators for Signal Confluence
The Signal Forge trading indicator includes 11 harmonized technical analysis filters that can be combined into a single strategy framework:
- SMA Crossover
- RSI Filter (Levels)
- MACD Crossover
- Supertrend
- Stochastic (Trend-based)
- Bollinger Bands (Basis Filter)
- EMA Crossover
- Awesome Oscillator
- Parabolic SAR
- CCI Filter
- ADX/DI Filter
By combining these filters, traders can test different forms of indicator confluence. For example, a trend-following strategy may use EMA Crossover, Supertrend, MACD, and ADX/DI together to confirm market direction. A more balanced strategy may include momentum tools like RSI, CCI, and Awesome Oscillator to confirm whether buying or selling pressure supports the trade idea.
This modular approach makes Signal Forge useful for exploring different trading strategies across stocks, crypto, forex, futures, and other chartable markets.
Managing Trades with ATR-Based Risk Settings
Signal Forge includes built-in ATR-based risk management tools for Take Profit, Stop Loss, and Trailing Stop levels. Because these levels are based on Average True Range, they automatically adapt to current market volatility.
When enabled, the indicator plots these levels directly on the chart so traders can see where potential exits would occur. This helps users evaluate not only the entry signal, but also the full trade structure.
The available risk management tools include:
- ATR Take Profit: Sets a volatility-based profit target.
- ATR Stop Loss: Sets a volatility-based protective stop.
- ATR Trailing Stop: Follows price as a trade develops, helping lock in gains while allowing room for continuation.
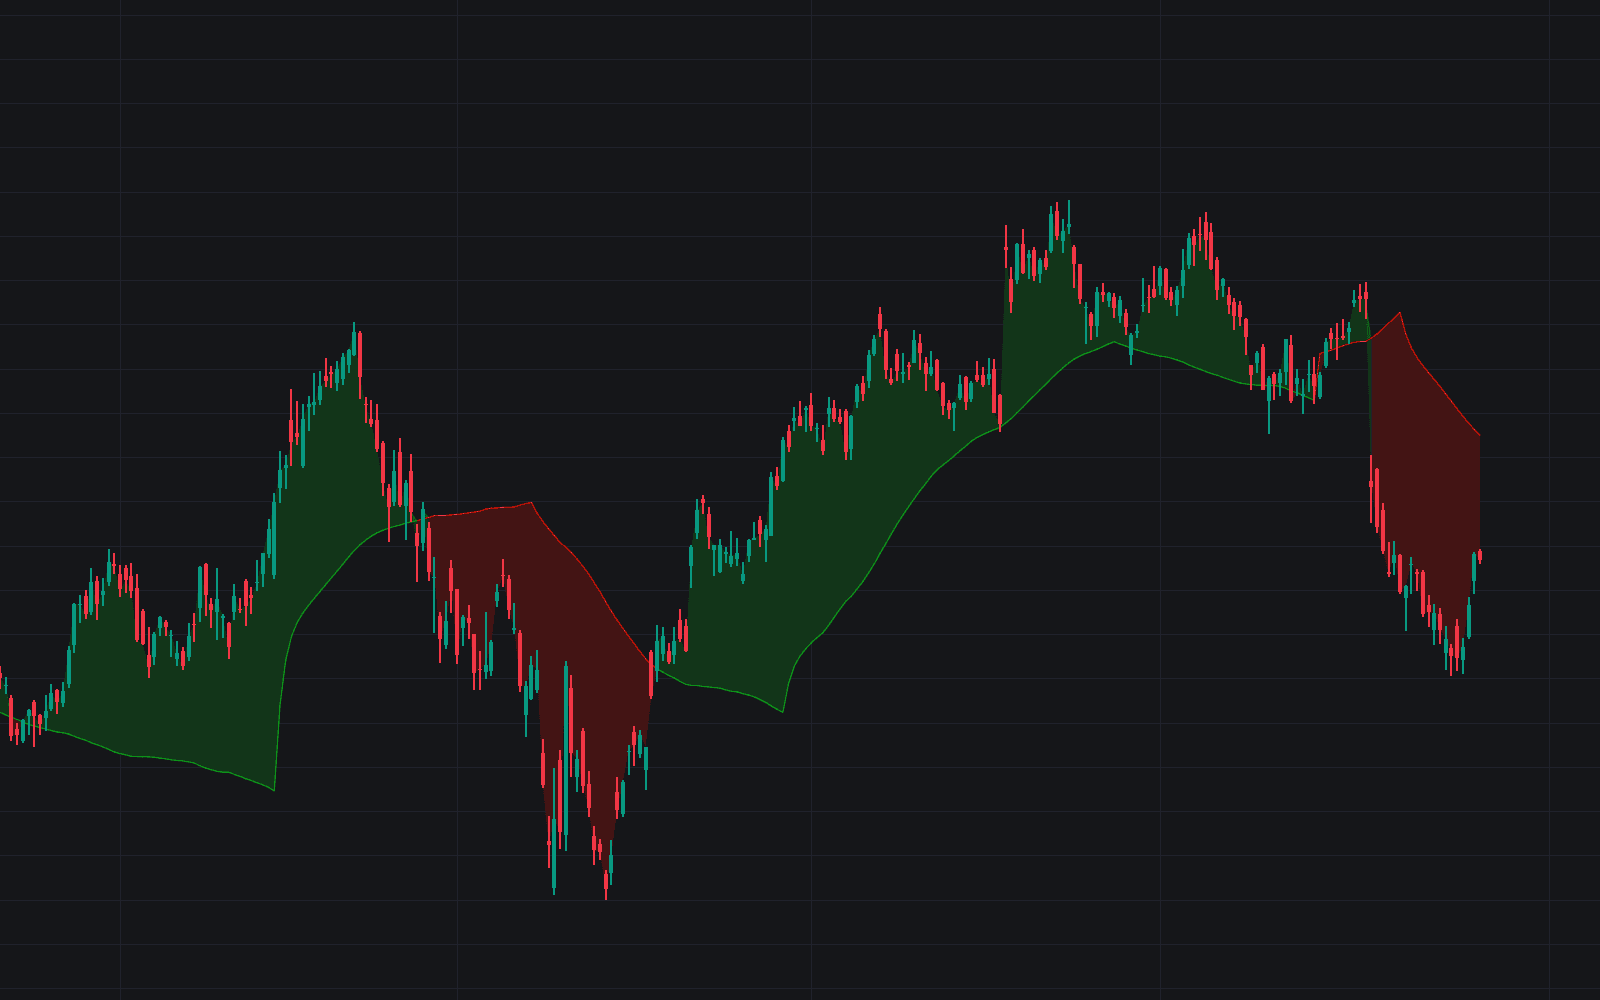
The trailing stop includes a gradient fill that highlights the space between price and the exit level. This makes it easier to visualize how much “breathing room” the trade has before the trailing stop is reached.
Signal Forge Indicator Details
Strategy Dashboards and Performance Tracking
Signal Forge includes two dashboard views that help traders monitor both individual indicator behavior and full strategy performance.
- Indicator Dashboard: Displays the real-time bullish or bearish status of all 11 indicators, each indicator’s standalone win rate, histogram-style performance visuals, and whether each filter is currently enabled.
- Performance Dashboard: Shows the combined strategy’s overall results, including Net Profit %, Win Rate, Profit Factor, and Total Trades.
These dashboards help traders quickly understand which technical indicators are contributing to the current signal and how the combined trading strategy has performed historically.
Harmonized Trading Logic for Cleaner Signals
Because different technical indicators are often designed for different trading styles, Signal Forge harmonizes the logic so each filter can work together more effectively.
For example, mean-reversion tools like Stochastic and Bollinger Bands are adapted to act as trend-confirmation filters. Instead of only looking for traditional overbought or oversold extremes, the Stochastic filter becomes bullish when %K is above 50, showing that momentum is in the upper half of its range. This allows it to align more naturally with trend-following indicators like moving averages, MACD, and Supertrend.
This harmonized structure helps reduce conflicting signals and makes it easier to build a more consistent trading strategy using multiple technical indicators.
Signal Forge Settings
Signal Logic Settings
- Require All Enabled Indicators to Align: When enabled, every selected indicator must show the same directional bias before Signal Forge generates a bullish or bearish signal.
This setting is useful for traders who want stronger confirmation before entering trades. Disabling it allows signals to trigger more easily when any active filter produces a valid condition.
ATR Risk Management Settings
- ATR Length: Controls the period used for volatility-based Take Profit, Stop Loss, and Trailing Stop calculations.
- Take Profit: Enables or disables ATR-based profit targets.
- Stop Loss: Enables or disables ATR-based protective stops.
- Trailing Stop: Enables or disables a volatility-based trailing exit.
- Multipliers: Adjust how far each ATR-based level is placed from the entry or current price.
These settings allow traders to customize the strategy for different markets, timeframes, and volatility conditions.
Visual Customization Settings
- Orb Distance (ATR): Controls how far signal orbs appear from the price candle using an ATR-based offset.
- Orb Base Size: Adjusts the size, thickness, and glow intensity of the signal markers.
These visual settings help traders keep their charts readable while still making signal events easy to identify.
Dashboard Settings
- Dashboards: Enables or disables the table overlays.
- Position/Size: Allows traders to move and scale the Indicator Dashboard and Performance Dashboard to fit their chart layout.
This gives users flexibility when working with different screen sizes, chart types, and multi-monitor setups.
FAQ
What is the Signal Forge indicator?
The Signal Forge indicator is a modular trading indicator that combines 11 technical analysis filters into one unified signal engine. It helps traders test indicator confluence, generate visual buy and sell signals, and review strategy performance directly on the chart.
How does Signal Forge help with trading strategy development?
Signal Forge helps traders build and test trading strategies by allowing them to toggle multiple indicators, choose strict or flexible signal logic, and evaluate historical performance using built-in dashboards and win rate labels.
What indicators are included in Signal Forge?
Signal Forge includes SMA Crossover, RSI, MACD, Supertrend, Stochastic, Bollinger Bands, EMA Crossover, Awesome Oscillator, Parabolic SAR, CCI, and ADX/DI filters.
Does Signal Forge include risk management tools?
Yes. Signal Forge includes ATR-based Take Profit, Stop Loss, and Trailing Stop settings. These help traders evaluate potential exits and manage trades based on market volatility.
How can I access the Signal Forge indicator?
You can get access on the LuxAlgo Library for charting platforms like TradingView, MetaTrader (MT4/MT5), and NinjaTrader for free.
Trading & investing are risky and many will lose money in connection with trading and investing activities. All content on this site is not intended to, and should not be, construed as financial advice. Decisions to buy, sell, hold or trade in securities, commodities and other investments involve risk and are best made based on the advice of qualified financial professionals. Past performance does not guarantee future results.
Hypothetical or Simulated performance results have certain limitations. Unlike an actual performance record, simulated results do not represent actual trading. Also, since the trades have not been executed, the results may have under-or-over compensated for the impact, if any, of certain market factors, including, but not limited to, lack of liquidity. Simulated trading programs in general are designed with the benefit of hindsight, and are based on historical information. No representation is being made that any account will or is likely to achieve profit or losses similar to those shown.
Testimonials appearing on this website may not be representative of other clients or customers and is not a guarantee of future performance or success.
As a provider of technical analysis tools and strategies, we do not have access to the personal trading accounts or brokerage statements of our customers. As a result, we have no reason to believe our customers perform better or worse than traders as a whole based on any content, tool, or platform feature we provide.
Charts used on this site are by TradingView in which the majority of our technical indicators are built on. TradingView® is a registered trademark of TradingView, Inc. www.TradingView.com TradingView® has no affiliation with the owner, developer, or provider of the Services described herein.
Market data is provided by CBOE, CME Group, BarChart, Massive, CoinAPI. Select U.S. equities data is provided through Massive. CBOE BZX real-time U.S. equities data is licensed from CBOE and provided through BarChart. Real-time futures data is licensed from CME Group and provided through BarChart. Select cryptocurrency data, including major coins, is provided through CoinAPI. All data is provided “as is” and should be verified independently for trading purposes.
This does not represent our full Disclaimer. Please read our full disclaimer.
© 2026 LuxAlgo Global, LLC.