Concept
Moving Average Crossovers
Moving Average Crossovers, also known as price/MA cross, dual-MA cross, triple-MA systems, are Trend concepts. The Library holds 3 implementations, each one a working definition you can pull into Quant.
Top Moving Average Crossovers indicators
The top custom implementations, built on the original standard Moving Average Crossovers formula.
3 total
Want to trade Moving Average Crossovers? Any of the 3 implementations below is one prompt away from a backtested strategy in Quant.
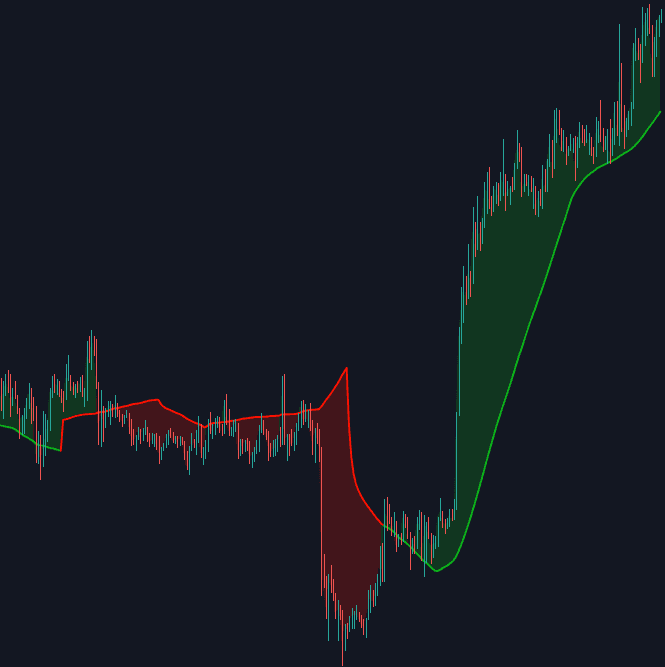
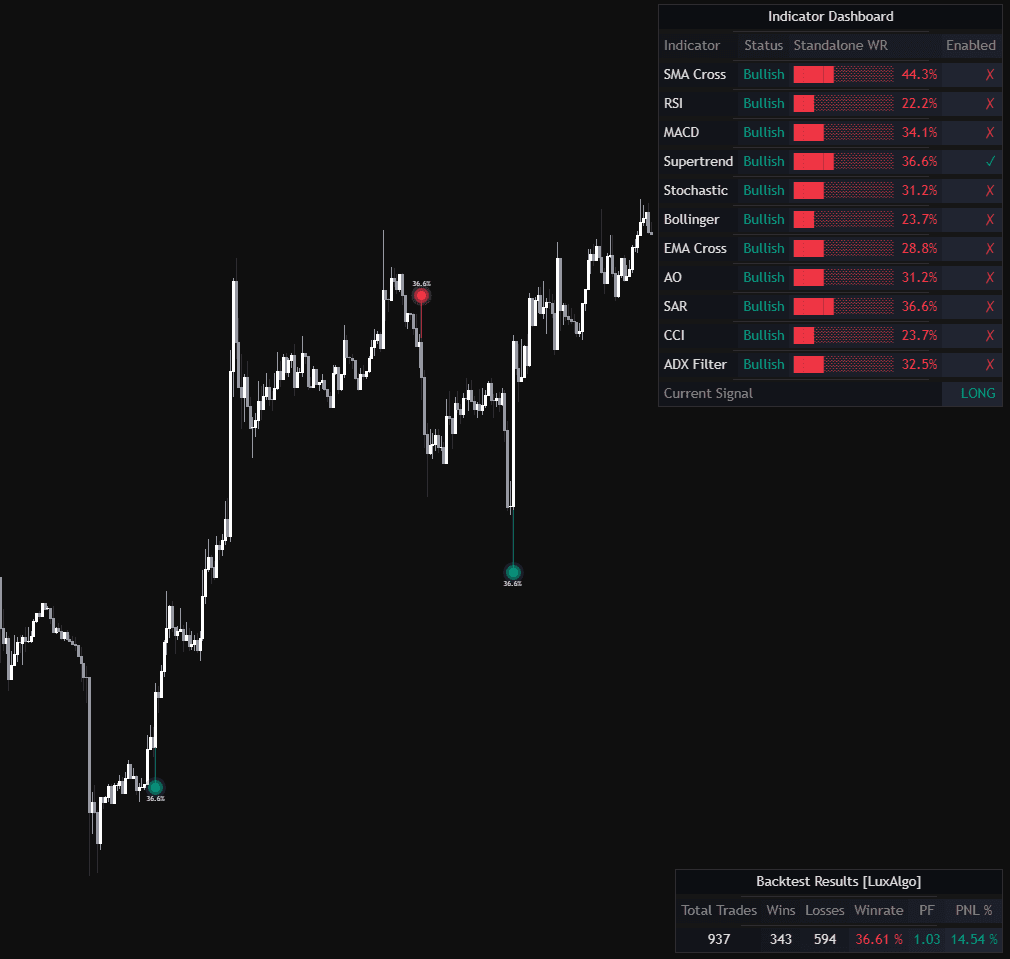
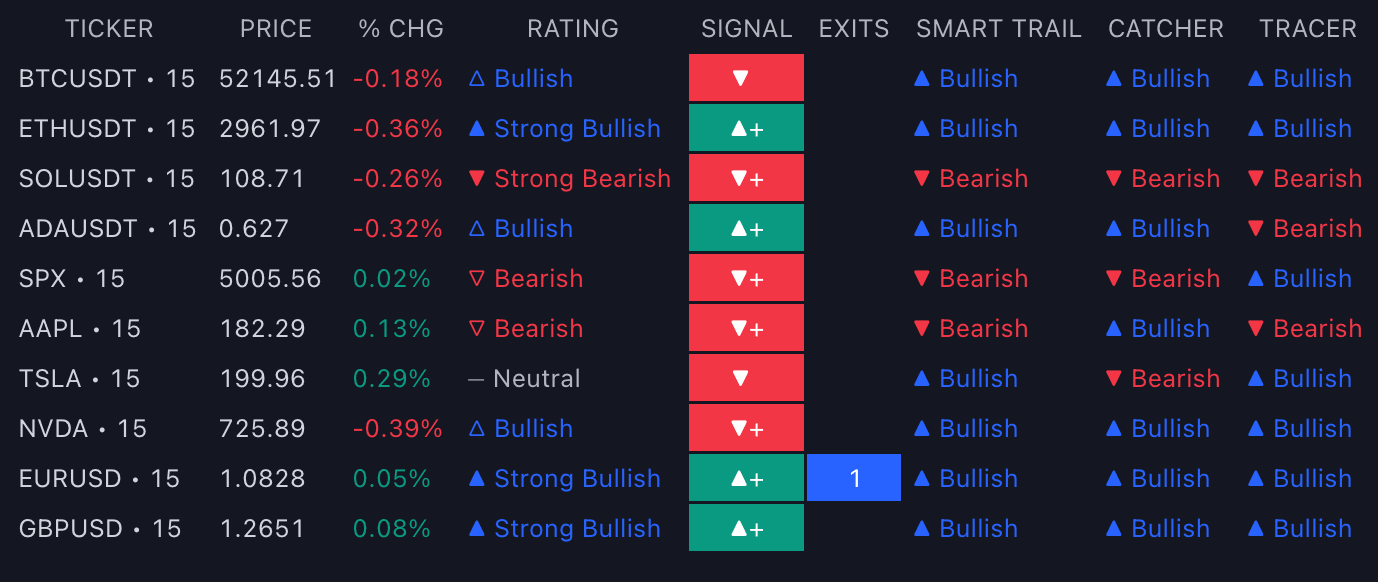
What are Moving Average Crossovers?
Moving average crossovers are the events where one plotted average crosses another, or where price crosses an average. Three standard forms exist: the price/MA cross (the close crosses a single average), the dual-MA cross (a fast average crosses a slow one, as in the 50/200 pair behind the Golden Cross), and triple-MA systems, which add a third, faster average as an early trigger while the slower pair defines the regime.
The mechanism is pure lag arithmetic. A shorter average tracks recent price more closely than a longer one, so when the trend turns up, the fast line rises through the slow line only after enough new prices have accumulated. A crossover therefore confirms that a directional change is already underway, and the cost of that confirmation is distance from the actual turn.
Crossovers matter because they are among the oldest fully objective trend signals: two lengths define the whole system, every bar yields an unambiguous state (fast above or below slow), and the rules backtest cleanly. That objectivity is also the weakness. In a trading range the averages flatten and braid around each other, generating whipsaw after whipsaw, which is why most practical systems filter the raw signal rather than trade every cross.
How to identify a moving average crossover
The event itself is mechanical; the judgment lives in the setup around it:
- 1Pick the pair: a fast and a slow length, such as a 9/21 EMA pair, the classic 50/200 pair, or price against a single average.
- 2Wait for the bar to close. An intrabar cross can uncross before the close, so signal on confirmed closes to avoid acting on a cross that never actually prints.
- 3Read direction: the fast line closing above the slow line is the bullish cross; closing below is the bearish cross, named a Death Cross when it happens on the 50/200.
- 4Grade the context: the slope of the slow average, the separation between the lines, and the higher-timeframe trend decide whether the cross looks like a trend change or range noise.
How it's calculated
Signal conditions that fire when price, or a faster moving average, closes across a slower moving average.
Any MA type can be used; EMAs cross earlier and SMAs later, and the golden/death cross convention is 50/200 SMAs on daily closes.
A cross is confirmed only at bar close, since an intrabar cross can uncross before the bar ends.
Common whipsaw filters require a minimum abs(Spread_t), a hold of several bars, or agreement with a longer MA.
How traders use it
- As an always-in trend system: long while fast is above slow, short or flat while below. Simple and testable, but dependent on trends persisting; extended ranges erode results one whipsaw at a time.
- As a regime filter rather than a trigger: many strategies only take longs while the fast average holds above the slow one, delegating actual entries to pullbacks or breakouts. A higher-timeframe trend filter is often this exact rule computed on a larger timeframe.
- As the raw material of derived indicators: MACD plots the distance between two EMAs, so its zero-line cross is a dual-MA crossover restated as an oscillator, with the spread's slope available before the cross completes.
- As a stacked read: plotting many lengths at once turns discrete crosses into a continuous alignment picture, the idea behind the MA ribbon and Guppy GMMA, where compression and fanning matter more than any single cross.
Moving average crossovers vs similar signals
Golden Cross: The Golden Cross is one specific instance: the 50-period average closing above the 200-period, conventionally on daily SMAs. Moving average crossovers are the general mechanism at any pair of lengths on any timeframe.
MACD: MACD measures the spread between two EMAs continuously instead of only flagging the moment it changes sign. That adds magnitude, slope, and divergence reads that a bare crossover lacks, at the price of an extra layer of interpretation.
MA Ribbon: A ribbon plots many averages and reads their order, spacing, and twists as a gradient of trend health. A crossover reduces all of that to a single binary event between two lines: cleaner to code, coarser to read.
MA Slope Filter: A slope filter asks whether one average is rising or falling; a crossover asks whether two lines have swapped order. Slope often turns earlier because it needs no second line to catch up, while a cross demands more sustained movement before it fires.
Concept family
Trend
100 concepts mapped · 100 in the Library
Moving Average Crossovers FAQ
Turn Moving Average Crossovers into a trading strategy.
Take any implementation from this page into Quant, then build on it, backtest it on real data, and keep refining it in conversation.