Volatility Contraction Pattern
 By LuxAlgoMar 2, 2026
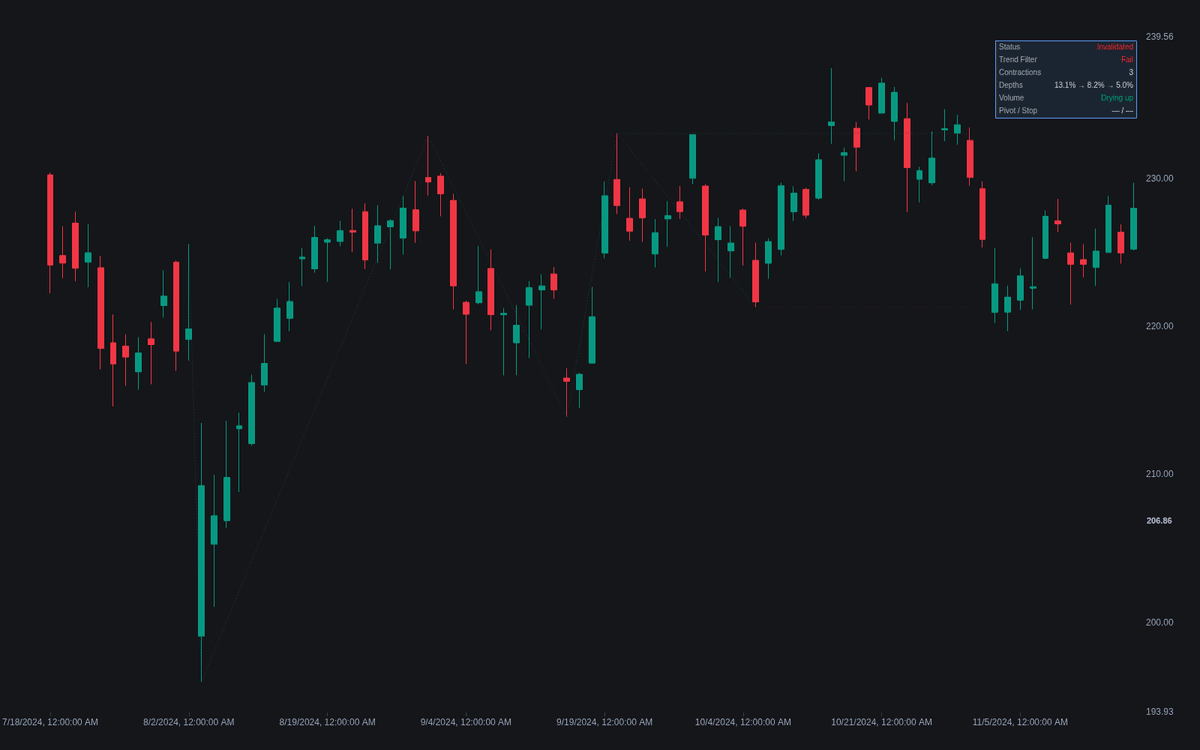

Volatility Contraction Pattern scans for Mark Minervini's tightening base: successive pullbacks, each meaningfully shallower than the last, volume drying up into the final coil, all inside a qualified uptrend. When a base qualifies, the build draws the Volatility Contraction Pattern as a zigzag with T1, T2… depth labels, sets the pivot at the top of the final tight area, the stop under its low, and marks the breakout on expanding volume.
How to Trade the Volatility Contraction Pattern?
- VCP Active: the sequence is tightening within the depth ratio and the filters pass; the dashboard tracks the full checklist.
- Pivot breakout: a close through the pivot on clear volume expansion completes the pattern; one that slumps straight back inside the base negates the setup.
- Stop discipline: risk is defined under the final contraction low; if that stop sits too far away, the coil has not tightened enough yet.
Volatility Contraction Pattern Settings
- Swing Length (default 5): scale of the swings each pullback is measured from.
- Contractions (defaults 2 to 4): fewest and most pullbacks kept; most bases carry two to four.
- Max Depth Ratio (default 0.75): each pullback may be at most this fraction of the prior depth. Lower values demand textbook bases.
- Qualify the Uptrend (default enabled): Minervini's prerequisite, judged by Trend SMA Length (default 200), Yearly Range Lookback (default 252), Max % Below Range High (default 25), and Min % Above Range Low (default 30).
- Require the Volume Signature (default enabled): a quiet final contraction and expansion on the break, against Volume Average Length (default 50) and Breakout Volume Multiplier (default 1.5).
- Show Dashboard (default enabled), plus style toggles Contraction Depth Labels and Show Stop Level (both default enabled).
Frequently Asked Questions

Original indicatorBuilt in-house by LuxAlgo
The Library is free. Quant makes it yours.
Pull any concept or indicator into Quant: rebuild it, retune it, or turn it into a backtested strategy of your own.