Concept
Volatility Contraction Pattern
Volatility Contraction Pattern, also known as VCP, Minervini, is a Volatility concept. The Library holds 1 implementation, a working definition you can pull into Quant.
Top Volatility Contraction Pattern indicator
The top custom implementation, built on the original standard Volatility Contraction Pattern formula.
1 total
This Volatility Contraction Pattern implementation is strategy-ready: open it in Quant, set your rules, and it backtests automatically.
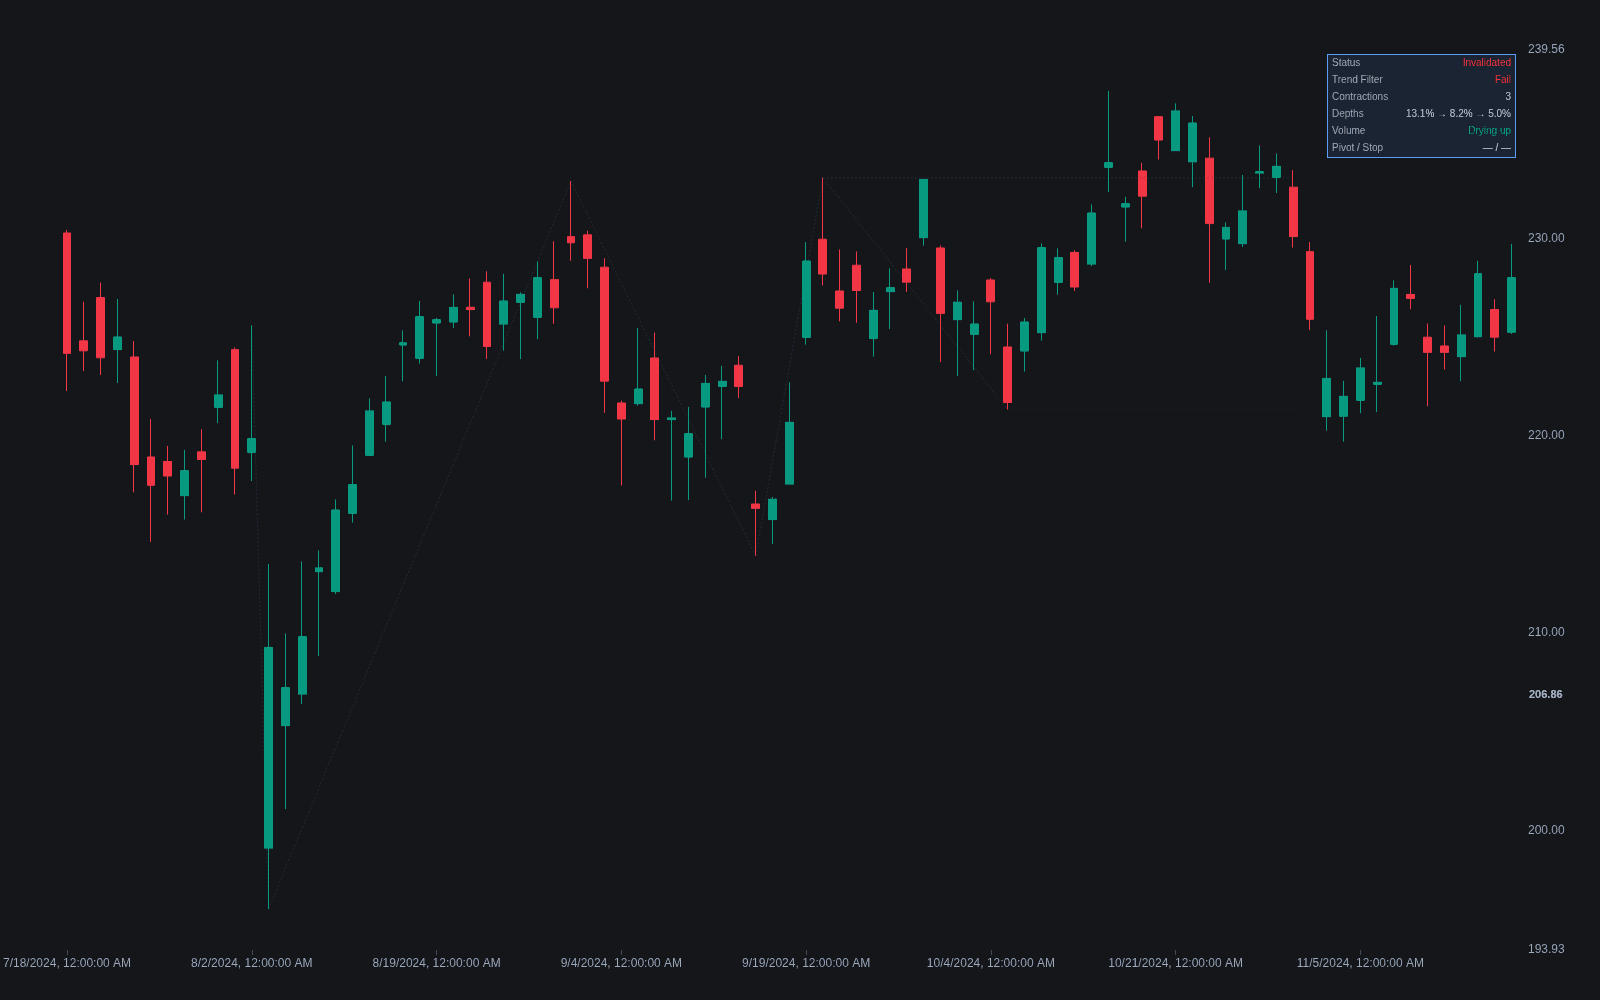
What is a Volatility Contraction Pattern?
The Volatility Contraction Pattern (VCP) is Mark Minervini's name for a base in which each successive pullback is smaller than the last: a correction of, say, 20% is followed by one near 10%, then 5%, tightening from left to right through typically two to four contractions, occasionally five or six. Volume contracts along with price, ideally showing a clear volume dry-up near the end. The logic is supply absorption: each shallower dip means fewer sellers remain, until price sits coiled in a tight pivot area.
Minervini frames the VCP inside a qualifying uptrend (his trend-template criteria) and treats the breakout through the pivot on expanding volume as the entry, with risk defined under the final contraction. The pattern formalizes older base-reading traditions, from Wyckoff-style absorption to the cup-with-handle lineage, into a measurable footprint of shrinking swings and shrinking volume. Tightness improves the risk-reward framing; it does not make the breakout succeed.
Minervini, winner of the 1997 U.S. Investing Championship, set the pattern out in Trade Like a Stock Market Wizard (2013) and Think & Trade Like a Champion (2017) as a centerpiece of his SEPA methodology. He presents it less as a new discovery than as a precise description of how sound bases behave: the handle of William O'Neil's cup-with-handle, properly formed, is a contraction, and Wyckoff's absorption narrative is the same supply story told decades earlier. What Minervini added was the explicit sequence and the insistence that each contraction be measured.
Because the pattern is defined by shrinking movement, standard volatility tools can quantify it. ATR declining through the base, Bollinger BandWidth compressing, a falling volatility percentile, or Donchian channel width narrowing all translate the visual footprint into numbers. The broader ATR expansion/contraction cycle explains why the setup exists: markets alternate between compression and expansion, and the VCP is a structured way of buying that turn inside an uptrend.
How to identify a Volatility Contraction Pattern
The pattern is read from left to right across a base that forms after a meaningful advance.
- 1Qualify the trend first: the stock should be in an established uptrend and trading in the upper portion of its yearly range before any base is considered.
- 2Mark each pullback within the base from swing high to swing low and measure its depth in percent.
- 3Check the sequence: each successive contraction should be meaningfully shallower than the one before, commonly near half its depth, with two to four contractions typical.
- 4Confirm the volume signature: volume should shrink as the base tightens, with notably quiet sessions in the final contraction.
- 5Define the pivot: the high of the final tight area is the actionable level, and a push through it on expanding volume completes the pattern.
How it's calculated
VCP describes a base whose successive pullbacks shrink in size while volume dries up, ending in a tight pivot ahead of a breakout.
Mark Minervini defines VCP by measurable properties rather than one equation, so automated detections differ across implementations.
Depths are measured from swing high to swing low within the base on a daily chart.
The halving ratio and the volume thresholds are guidelines, not strict rules.
How traders use it
- As a base qualifier: within an established uptrend, successive pullback depths are measured, and the base qualifies when each contraction is meaningfully smaller than the prior one while volume dries up.
- As an entry trigger: buy the move through the pivot (the high of the final tight area) on clear volume expansion, with the stop under the last contraction's low so the risk stays small relative to the expected move.
- As a screening template: contraction counts, depth ratios, and volume trends can be computed programmatically, letting scanners surface VCP candidates across a large universe.
- For squeeze confluence: a TTM Squeeze or Bollinger Squeeze condition during the final contractions adds an objective check that volatility really has contracted.
- For trade management: after entry the expectation is range expansion; a breakout that immediately sinks back into the base contradicts the setup and is commonly cut quickly rather than given room.
VCP vs other compression concepts
Bollinger Squeeze: The squeeze is an indicator condition: band width at multi-period lows, wherever and however it happens. A VCP is a price-structure template with prerequisites: an uptrend, a stepped sequence of shallower pullbacks, and a volume signature. Most VCPs show a squeeze somewhere; few squeezes qualify as VCPs.
TTM Squeeze: TTM defines compression objectively as Bollinger Bands trading inside Keltner Channels and adds a momentum histogram for direction. It fires on any symbol in any regime, long or short, while the VCP is specifically a bullish continuation framework.
Range Expansion/contraction: Expansion/contraction describes the general alternation every market cycles through, with no directional bias. The VCP is that cycle harnessed into a specific bullish setup: contraction inside an uptrend, bought at the moment expansion begins.
Concept family
Volatility
57 concepts mapped · 57 in the Library
Volatility Contraction Pattern FAQ
Turn Volatility Contraction Pattern into a trading strategy.
Take the implementation from this page into Quant, then build on it, backtest it on real data, and keep refining it in conversation.