2 Moving Average Crossover Strategies - Explained
There are two common ways to trade a moving average crossover: compare price with one average, or compare a faster average with a slower one. Both turn price history into a repeatable signal. Neither establishes that a new trend will continue, and adding a second average does not automatically improve profitability or reduce risk.
This guide explains the rules, SMA and EMA choices, whipsaw filters, and a practical way to compare both strategies in LuxAlgo charts with Quant, our coding agent. The numerical examples are hypothetical and illustrate mechanics rather than recommended settings.
Quick Comparison
| Question | Price crossover | Double moving average crossover |
|---|---|---|
| What crosses? | Price crosses one moving average. | A fast average crosses a slow average. |
| What is measured? | Price relative to a smoothed reference. | Two differently smoothed versions of price. |
| Main trade-off | Direct price response can generate repeated signals around the line. | Additional smoothing can delay both entry and exit. |
| Trading horizon | Depends on bar interval, average length, and exit rules. | Also depends on bar interval, lengths, and exits. |
| Risk and reliability | Must be evaluated after sizing, costs, and execution assumptions. | Must be evaluated the same way; two lines are not a safety guarantee. |
Either method can participate in sustained trends and lose repeatedly in sideways movement. A daily price/200-day-average system can be much slower than a 5/9-average system on a one-minute chart. Strategy names alone do not determine speed or suitability for scalping, swing trading, or investing.
1. Moving Average Price Crossover Strategy
Define the Crossing Event
Choose the price source, average type, lookback, and chart interval first. For a close-based bullish crossover, require the previous completed close to be at or below its average and the current completed close to be above its average. For a bearish crossover, reverse those comparisons.
- Bullish: previous close ≤ previous MA, and current close > current MA.
- Bearish: previous close ≥ previous MA, and current close < current MA.
Being above the average is a state; crossing above it is an event. Without the previous-bar condition, a strategy may keep issuing entries on every bar that stays above the line. Decide whether equality counts on the prior bar and whether you permit additional entries while already holding a position.
Example: yesterday’s close was $99 and its moving average was $100. Today’s completed close is $102 and its average is $100.50. That is a bullish crossing event. If tomorrow closes at $103 above an average of $101, the bullish state continues, but there is no new cross.
StockCharts’ price-crossover guide discusses completed-candle confirmation and market context. Confirmation means the rule has occurred; it does not mean the trade will succeed.
Separate Signal Time from Entry Price
If a rule requires the completed close, that closing value is not known earlier in the bar. A straightforward research assumption is to submit a market entry for the next available bar after confirmation. Record that assumption explicitly instead of silently granting the backtest the signal bar’s closing price.
Suppose the crossover close is $102 but the next session opens at $104. A simulated entry at $102 understates the price you might have paid under a next-session rule. A limit at $102 could avoid paying more, but it may never execute. A different order model creates a different strategy.
For a long-only system, a bearish crossover can mean exit to cash. It does not have to mean opening a short. If you add short positions, account for instrument eligibility, borrow availability and fees where relevant, margin, and the possibility of much larger losses.
Strengths and Limitations
The price-crossover method is easy to explain and audit. It provides a consistent way to stop treating every price fluctuation as a discretionary decision. However, averages lag, and a price can cross back repeatedly before a sustained move develops. A moving average is also not a guaranteed support or resistance level.
Its simplicity makes it a useful baseline. Test the baseline before adding filters so that you can measure what each extra condition changes. More conditions can remove losing trades, but they can also exclude the few large winners that support a trend-following result.
2. Double Moving Average Crossover Strategy
Compare a Fast Average with a Slow Average
Calculate both averages on the same selected price series and interval, with a shorter and a longer lookback. A bullish crossover occurs when the fast average moves from at or below the slow average to above it. A bearish crossover occurs when it moves from at or above to below.
Example: the previous fast and slow values are 100.20 and 100.40. On the current completed bar, they are 100.60 and 100.50. The fast average has crossed above the slow average. Merely having the fast line above the slow line on several subsequent bars should not create repeated crossover events.
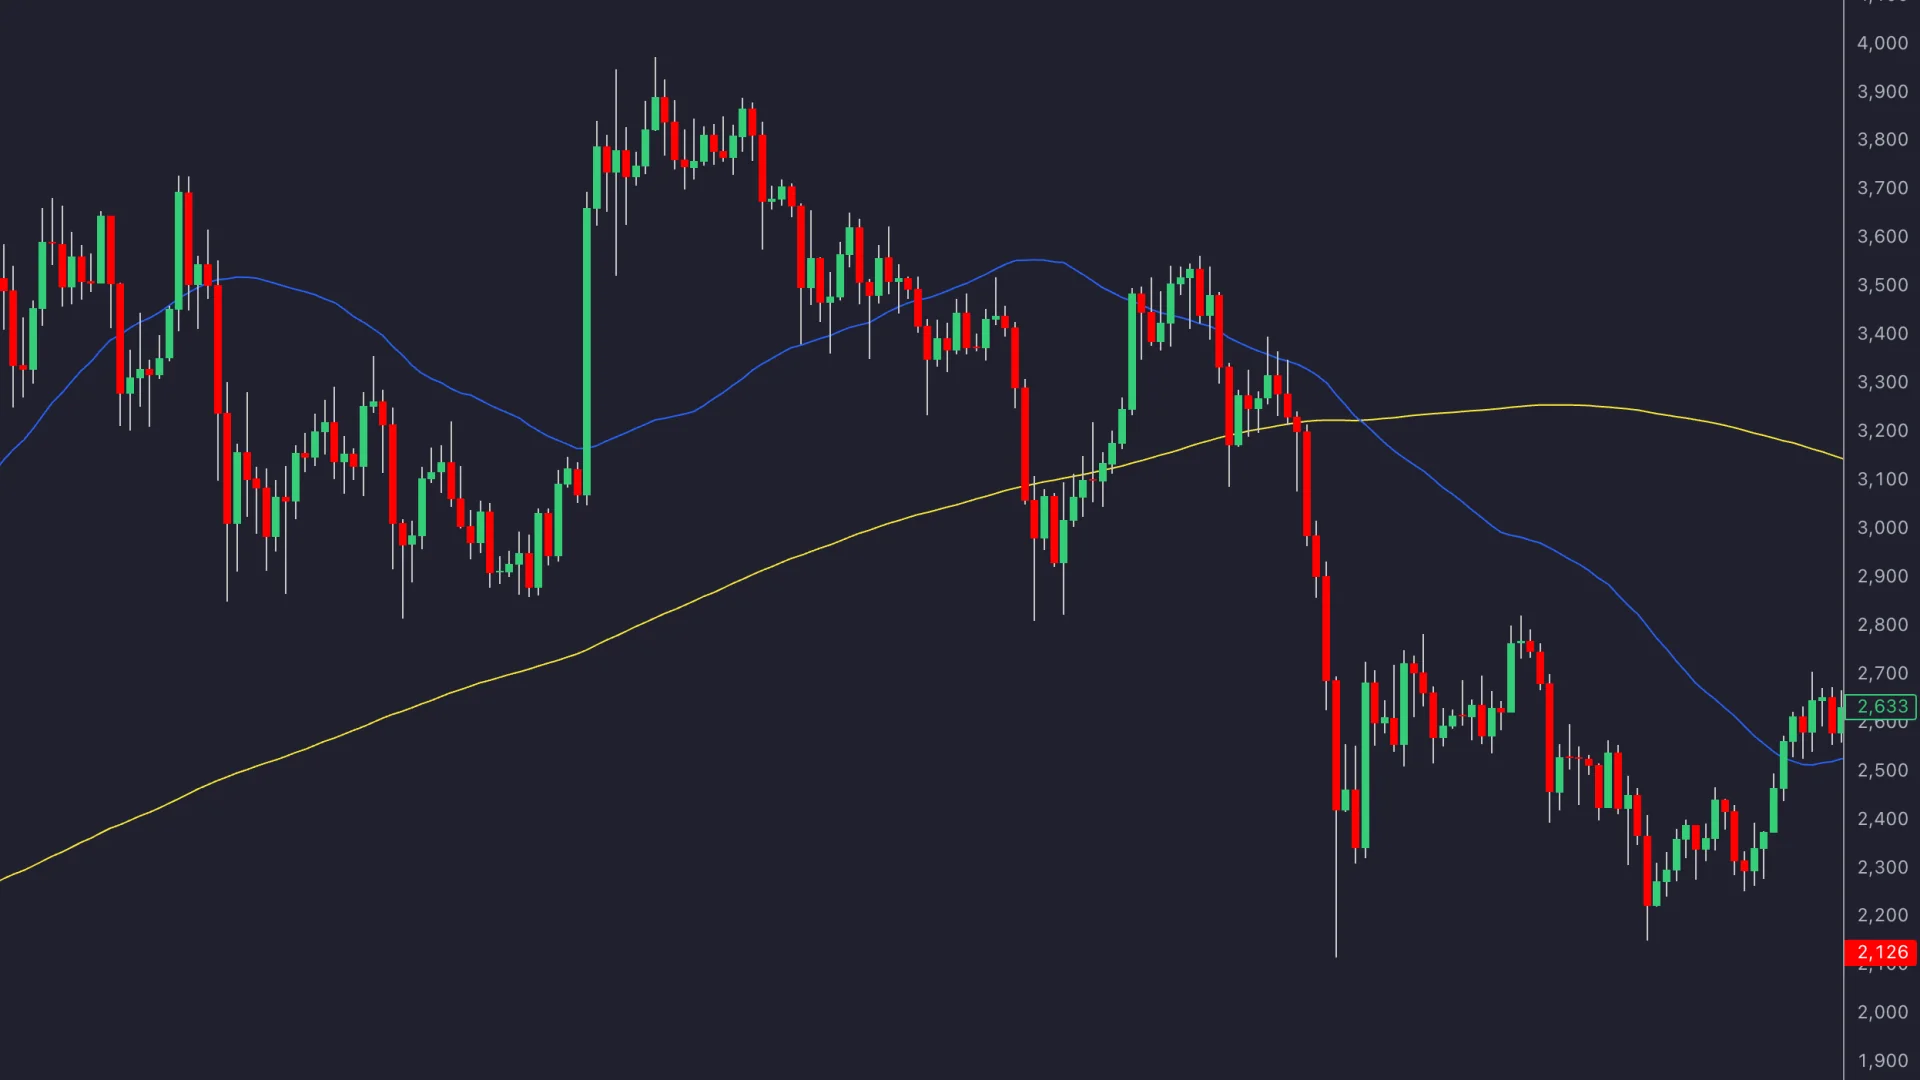
The terms golden cross and death cross are commonly associated with bullish and bearish 50-day/200-day moving-average crosses. Other fast/slow pairs use the same crossing logic, but should be identified by their actual settings rather than treated as equivalent signals.
A double crossover may respond less often than price against a comparable slow average, but this is not a universal ranking across all parameter choices. Smoothing can reduce small fluctuations while also producing a later exit during a sharp reversal. Evaluate the whole return and drawdown path.
Choose SMA or EMA Deliberately
A simple moving average gives equal weight to the selected observations. An exponential moving average gives greater weight to recent prices and uses its previous value in the next calculation. Its response depends on the smoothing and initialization.
For closes of 98, 100, 101, 99, and 102, the five-period SMA is 100. If the next close is 105, the oldest 98 drops out and the SMA becomes 101.40. The average moves even though it is built entirely from observed prices.
With the conventional EMA smoothing factor 2 ÷ (length + 1), a nine-period EMA uses a factor of 0.2. If the previous EMA is 100 and the latest close is 105, the new value is 101. Different initialization or available history can produce slightly different early values, so allow enough warm-up data before evaluating signals.
| Example setting | What it means | What to test |
|---|---|---|
| Price versus 20-period SMA | One rolling reference against each completed close. | Crossing frequency and exit delay. |
| 5/9 EMA pair | Two short lookbacks on the chosen interval. | Turnover, costs, and sensitivity to small movements. |
| 9/21 EMA pair | A wider separation between fast and slow lookbacks. | Whether different timing improves net results. |
| 50/200 SMA pair | A slower configuration on the same interval. | Warm-up requirements, time in the market, and large reversals. |
Periods are bars, not automatically days. A 50-period average on an hourly chart summarizes 50 hourly bars; a 50-day average requires daily data. Neither SMA nor EMA is inherently reserved for a particular trading style. Choose a small set of plausible configurations, document them, and test them fairly.
Managing Whipsaws and Timeframes
A whipsaw is a signal followed by a reversal that undermines the intended trade. Define how you will measure it: an opposite cross within a fixed number of bars, a stopped-out trade, or a net loss after costs. These are different outcomes, so a published “false-signal rate” is not transferable without its rules and dataset.
Four Filters to Test
- Completed-bar confirmation: evaluate the rule once the bar closes. This avoids treating every intrabar fluctuation as a final cross but delays action.
- Distance or persistence: require price or the fast average to clear a defined buffer, or remain across the line for a set number of closes. These filters can exclude brief crosses and also miss early trend entries.
- Trend context: test a slope rule or a defined ADX condition. ADX measures trend strength rather than direction, and any threshold must be evaluated rather than assumed to work universally.
- Participation or session context: test a volume comparison or restrict entries to defined sessions. Keep data coverage and time-of-day patterns consistent.
For a hypothetical 0.5% price buffer above an average of $100, a $100.30 close does not qualify; a $100.60 close does. The threshold changes with the average. Specify whether the buffer only filters the crossing bar or permits a delayed entry after the initial cross; those implementations produce different trades.
A two-close confirmation rule also needs a state definition. You might enter only on the first completed bar that makes two consecutive closes above the average after an eligible crossing. Do not accidentally enter on every later bar that satisfies “the last two closes were above.”
Use Confirmed Higher-Timeframe Data
If an hourly entry depends on a daily trend filter, yesterday’s completed daily value is available throughout today. Today’s final daily value is not. Using the eventual daily close to approve earlier hourly trades introduces future information. Intrabar crosses can also disappear before a bar closes; the Pine Script repainting documentation explains this historical-versus-realtime distinction.
Longer intervals are not automatically more profitable, and shorter intervals are not automatically better in volatile markets. Evaluate the same execution and cost assumptions. In sideways conditions, reducing activity or taking no trades may be more appropriate than tightening stops and trading more frequently.
Avoid Redundant Confirmation
RSI and Stochastic can add a momentum condition, but an overbought reading is not automatically bearish in a strong trend. MACD is itself derived from moving averages, so it may overlap substantially with a crossover rule. Bollinger Bands describe price dispersion around an average; they do not guarantee that a range will persist.
Test one additional condition at a time. Compare the filtered and unfiltered versions on the same dates, including how many winning trends the filter removed. A higher win rate can coexist with lower net profit if the largest winners disappear.
Video: Filtering Moving Average Whipsaws
This Looking at the Markets tutorial provides additional examples of crossover filters. Use its chart discussion to develop hypotheses, then test explicit rules on your own data; illustrative examples are not a performance guarantee.
Compare Both Strategies with the Same Risk and Costs
A fair comparison keeps the instrument, history, session, capital, sizing, commissions, and simulated execution model consistent. Compare net profit, maximum drawdown, trade count, average trade after costs, and time in the market. A strategy spending much longer in cash has different exposure from one that stays invested.
Five-trade example: three wins of +3R and two losses of −1R produce a 60% win rate and +7R before costs. The average is +1.4R per trade. That arithmetic does not produce +7.7R unless the trade outcomes or weighting differ. Five trades are far too little evidence to establish a dependable edge, especially if they occurred during one favorable trend.
Here, R is each trade’s planned initial risk. If risk budgets vary, adding R-multiples is not the same as adding dollar profits. Report both where useful, and include losing periods rather than selecting a successful month.
Cost example: a strategy earns $600 over 100 trades before costs. At $8 per round trip for combined commissions, spread, and slippage, the result is −$200. A smoother equity curve before costs can therefore be misleading.
Size positions independently of the crossover label. A $150 planned risk budget with a $3 entry-to-stop distance permits 50 shares before costs. A gap can produce a larger loss. A crossover exit or a stop line drawn on a chart is not a guaranteed execution price; review the SEC’s order-type guidance.
Test Both Crossover Methods in LuxAlgo
Use LuxAlgo charts to inspect the symbol, interval, and moving averages, then use Quant, our coding agent, to turn the exact rules into a strategy you can review and run. Keep the visual indicator and the simulated order logic consistent.
Build Two Separate Baselines
For the price-crossover baseline, specify a long-only entry after a completed close crosses above a 20-period SMA and an exit after a completed close crosses below it. For the double-crossover baseline, substitute a 9-period EMA crossing a 21-period EMA. Request one position at a time and an explicit next-bar execution assumption. These settings illustrate the workflow rather than an optimized pair.
Follow the Quant strategy workflow: review the generated code, run it, and inspect the report. Check previous/current-bar comparisons, average types, position handling, and exits. Successful compilation does not prove that the strategy implements your intended rules.
Set capital, order size, commissions, and slippage in the strategy properties. Open the Trades Log and performance analysis to inspect sample entries and exits against the chart. Save runs with their symbol, interval, parameters, and assumptions before changing anything.
Test Filters on Reserved Data
Compare each baseline with one defined filter over the same history. Keep a log of every variant and reserve later data that was not used to choose the settings. Try nearby lengths to see whether the result depends on one narrow parameter combination. These are research steps you design, not automatic guarantees supplied by an AI tool.
Ensure sufficient history for the slow average and its warm-up. The data guide explains available sources and coverage. For U.S. equities, EDGX volume is venue-specific; do not compare it as though it were consolidated market volume when adding a participation filter.
Use the current plan comparison for data, history, and usage allowances rather than choosing a plan from an old asset count or credit table. Documentation and educational examples can help you build a test, but another trader’s successful settings are not validation for your market.
FAQs
How can I avoid false signals when using moving average crossover strategies?
You cannot eliminate them. Test completed-bar confirmation, a defined buffer or persistence rule, and market-context filters against the same unfiltered baseline. Measure net results and missed winners as well as the number of losing signals.
What other indicators can complement moving average crossover strategies for better accuracy?
ADX, RSI, volume, or a confirmed higher-timeframe condition can provide additional context. MACD may overlap with the moving averages already used. Test each addition separately; more indicators do not automatically improve accuracy or profitability.
When do moving average crossover strategies work best, and how can I adapt them for sideways markets?
They are designed to participate in sustained price movement but can repeatedly reverse in ranges. A predefined filter, reduced exposure, or no-trade rule may help, at the cost of missing some trends. Both strategies still require testing, realistic costs, and risk limits.
Read next