Concept
Golden Cross
Golden Cross is a Trend concept. The Library holds 1 implementation, a working definition you can pull into Quant.
Top Golden Cross indicator
The top custom implementation, built on the original standard Golden Cross formula.
1 total
The Golden Cross implementation below can become a backtested trading strategy — describe your rules and Quant writes the code.
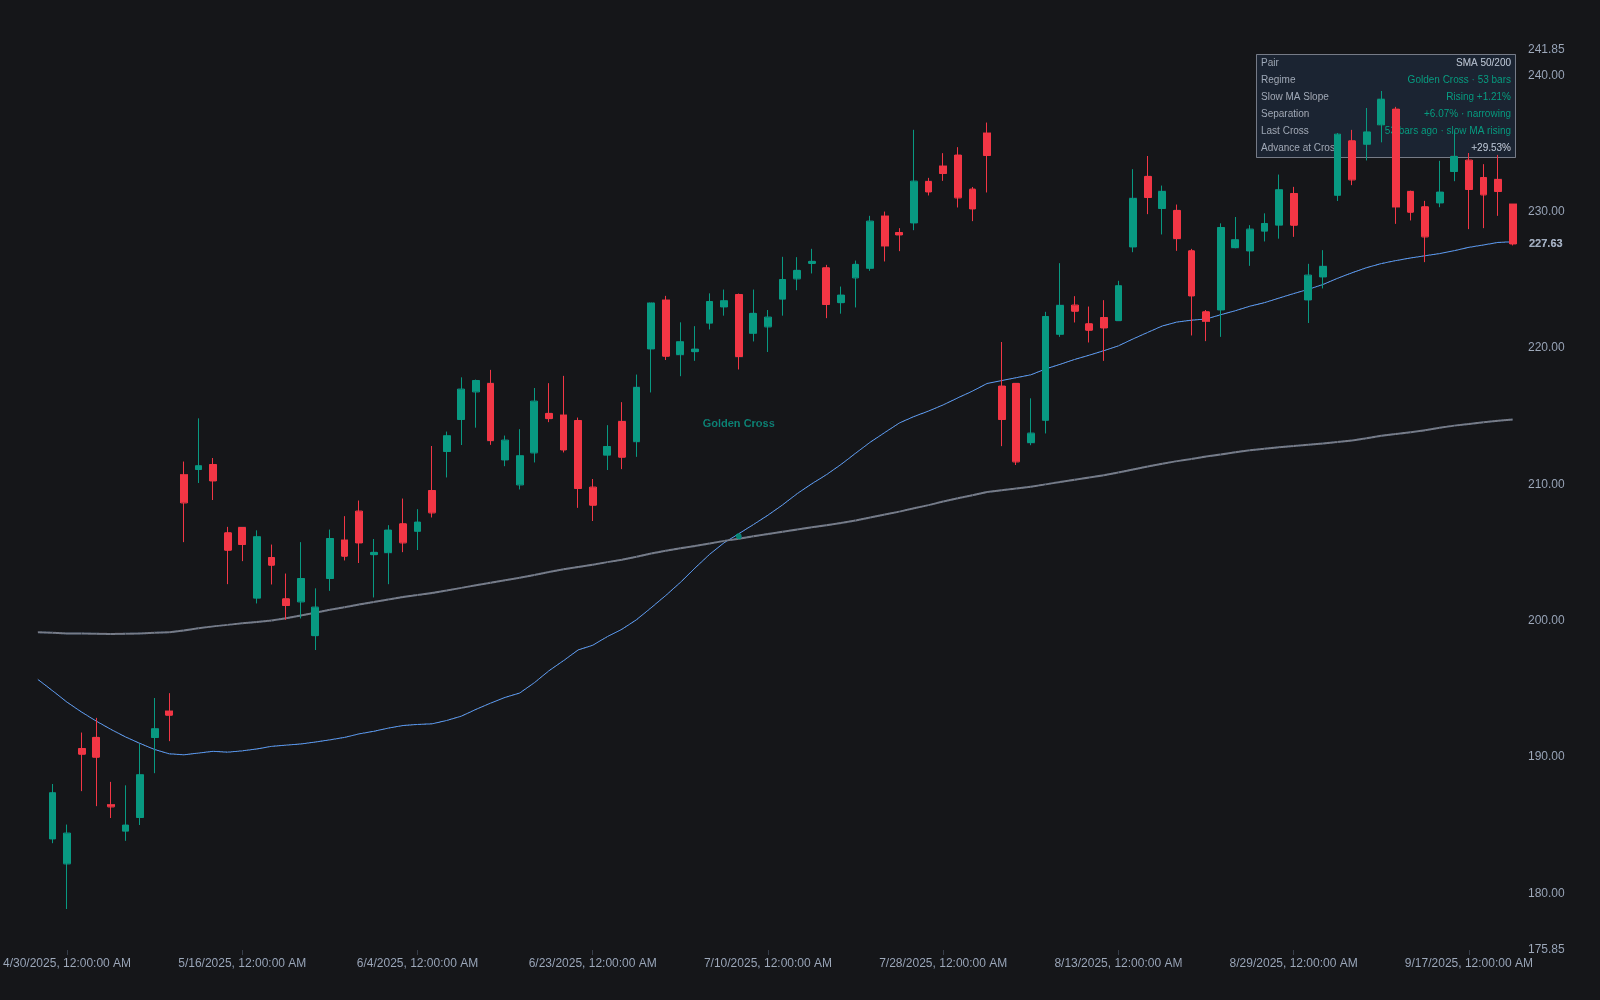
What is a Golden Cross?
A golden cross is the event where a shorter moving average crosses above a longer one, and in its classic form specifically the 50-day simple moving average crossing above the 200-day on a daily chart. Because both averages look far back, the cross confirms that intermediate momentum has overtaken the long-term base only after a substantial advance has already occurred: it is a lagging, regime-level statement that the larger trend has turned up, not a timing signal.
Its mirror image is the death cross, the same pair crossing downward. Both are the most publicized cases of moving average crossovers, which is part of their significance: the daily 50/200 pair is tracked widely enough that the events themselves are reported and watched across the market.
The publicity is not incidental to how the signal behaves. Because financial media and screeners announce daily 50/200 crosses on major indexes and large stocks, the event arrives pre-marketed, and some of the reaction around it is the audience reacting to the announcement. Studies of the signal's track record report mixed results that vary by market and era: long stretches where the regime read was valuable, and sideways periods where crosses chained into whipsaws.
Definition details matter more than the folklore suggests. Simple versus exponential averages shift cross dates by days, weekly-chart versions fire far less often than daily ones, and a cross that prints while the 200-day still falls describes a different market than one with both averages rising. Treating the event as one input to a regime judgment, rather than as the judgment itself, is how most systematic users survive its lag.
How to identify a golden cross on a chart
The event is mechanical; the quality assessment around it is where the reading lives.
- 1Plot the 50- and 200-period simple moving averages on the daily chart (or note explicitly that you are using a nonstandard pair or timeframe).
- 2Mark the cross: the bar where the 50-day closes above the 200-day after being below it.
- 3Grade the context: a 200-day that has flattened or turned up makes the cross a cleaner regime statement than one still falling.
- 4Measure what preceded it: the further price already ran from the low, the more of the move the cross has consumed, which is the signal's structural cost.
- 5Watch the aftermath: an immediate re-cross downward marks the whipsaw failure mode, most common when the averages braid through a sideways market.
How traders use it
- As a regime filter: a standing golden cross defines a bullish backdrop in which pullback buys and breakout entries are permitted, while its absence keeps long exposure conservative.
- As a screening condition across watchlists, flagging symbols whose long-term trend has just turned up for closer analysis.
- As confirmation layered on faster signals rather than an entry in itself, since by the time the averages cross, a meaningful part of the move has usually happened.
- As one vote in a regime stack: pairing the cross with an MA slope filter on the 200-day, or a broader trend regime label, filters the crosses that print inside directionless chop.
- As a portfolio throttle: some longer-horizon approaches scale overall equity exposure with the state of the index's 50/200 relationship, accepting late entries and exits in exchange for skipping the worst regimes.
Golden Cross vs other regime signals
Moving Average Crossovers: The golden cross is one celebrated instance of the general crossover family, pinned to the daily 50/200 pair. Generic crossovers trade the same logic at any speed; the golden cross trades slower and carries the extra weight of being watched by everyone.
Supertrend: Supertrend flips when price crosses a volatility-offset trail, so its state changes far faster than a 50/200 cross and whipsaws proportionally more. The golden cross is the heavier, slower regime read; Supertrend is a tactical trail.
Trend Regime Label: A regime label can combine slope, separation, and volatility conditions into its state, updating continuously. The golden cross is a single binary event on one pair of averages: cruder, but universally understood and easy to audit.
Concept family
Trend
100 concepts mapped · 100 in the Library
Golden Cross FAQ
Turn Golden Cross into a trading strategy.
Take the implementation from this page into Quant, then build on it, backtest it on real data, and keep refining it in conversation.