Band Indicators: Volatility in Trading Explained
Band indicators show price in relation to an average and a measure of variation. Bollinger Bands and Keltner Channels can help define breakout or mean-reversion setups, but neither supplies a fixed probability that price will stay inside its boundaries.
Use LuxAlgo’s native charts to compare the indicators, then work with Quant to build and test a specific rule. Start with the calculation and entry logic, rather than assuming one band type is always best for a particular market.
Bollinger Bands and Keltner Channels Compared
| Feature | Traditional Bollinger Bands | Common modern Keltner Channels |
|---|---|---|
| Center | Simple moving average | Exponential moving average |
| Width measure | Standard deviation of the selected price series | Average True Range |
| Example settings | 20 periods, 2 standard deviations | 20-period EMA, separately defined ATR length, factor 2 |
| Main interpretation | Price dispersion relative to its average | Range-based distance from its average |
| Containment guarantee | None | None |
These are common versions, not the only available implementations. Check the price source, average type, lookback, range calculation, and smoothing. A 20-period setting uses 20 chart bars; it means 20 days only on daily bars.
Bollinger Bands
The traditional upper and lower bands add and subtract a multiple of standard deviation from a simple average. A typical example uses 20 periods and a multiplier of 2. Narrowing width describes lower dispersion; widening describes higher dispersion.
Do not interpret two standard deviations as a guarantee that 95% of market prices will fall inside the bands. John Bollinger’s official rules explicitly caution against statistical assumptions based on the band calculation. Observed containment depends on the data and settings and is not a promised future probability.
Keltner Channels
A common modern Keltner Channel uses an EMA plus and minus an ATR multiple. ATR includes gaps relative to the prior close. Some implementations offer other moving averages or range measures, so the ATR length and method must be specified separately. TradingView’s Keltner reference explains these options.
There is no general 90% price-containment rule for Keltner Channels. Their apparent smoothness depends on the parameters and price history, and width alone does not tell you whether the next move will be bullish or bearish.
Read the Chart Without Assuming a Reversal
A price near an outer band is relatively far from the center under that calculation. It can continue farther in a trend, return toward the average, or move sideways while the band catches up. A touch alone does not select among those outcomes.
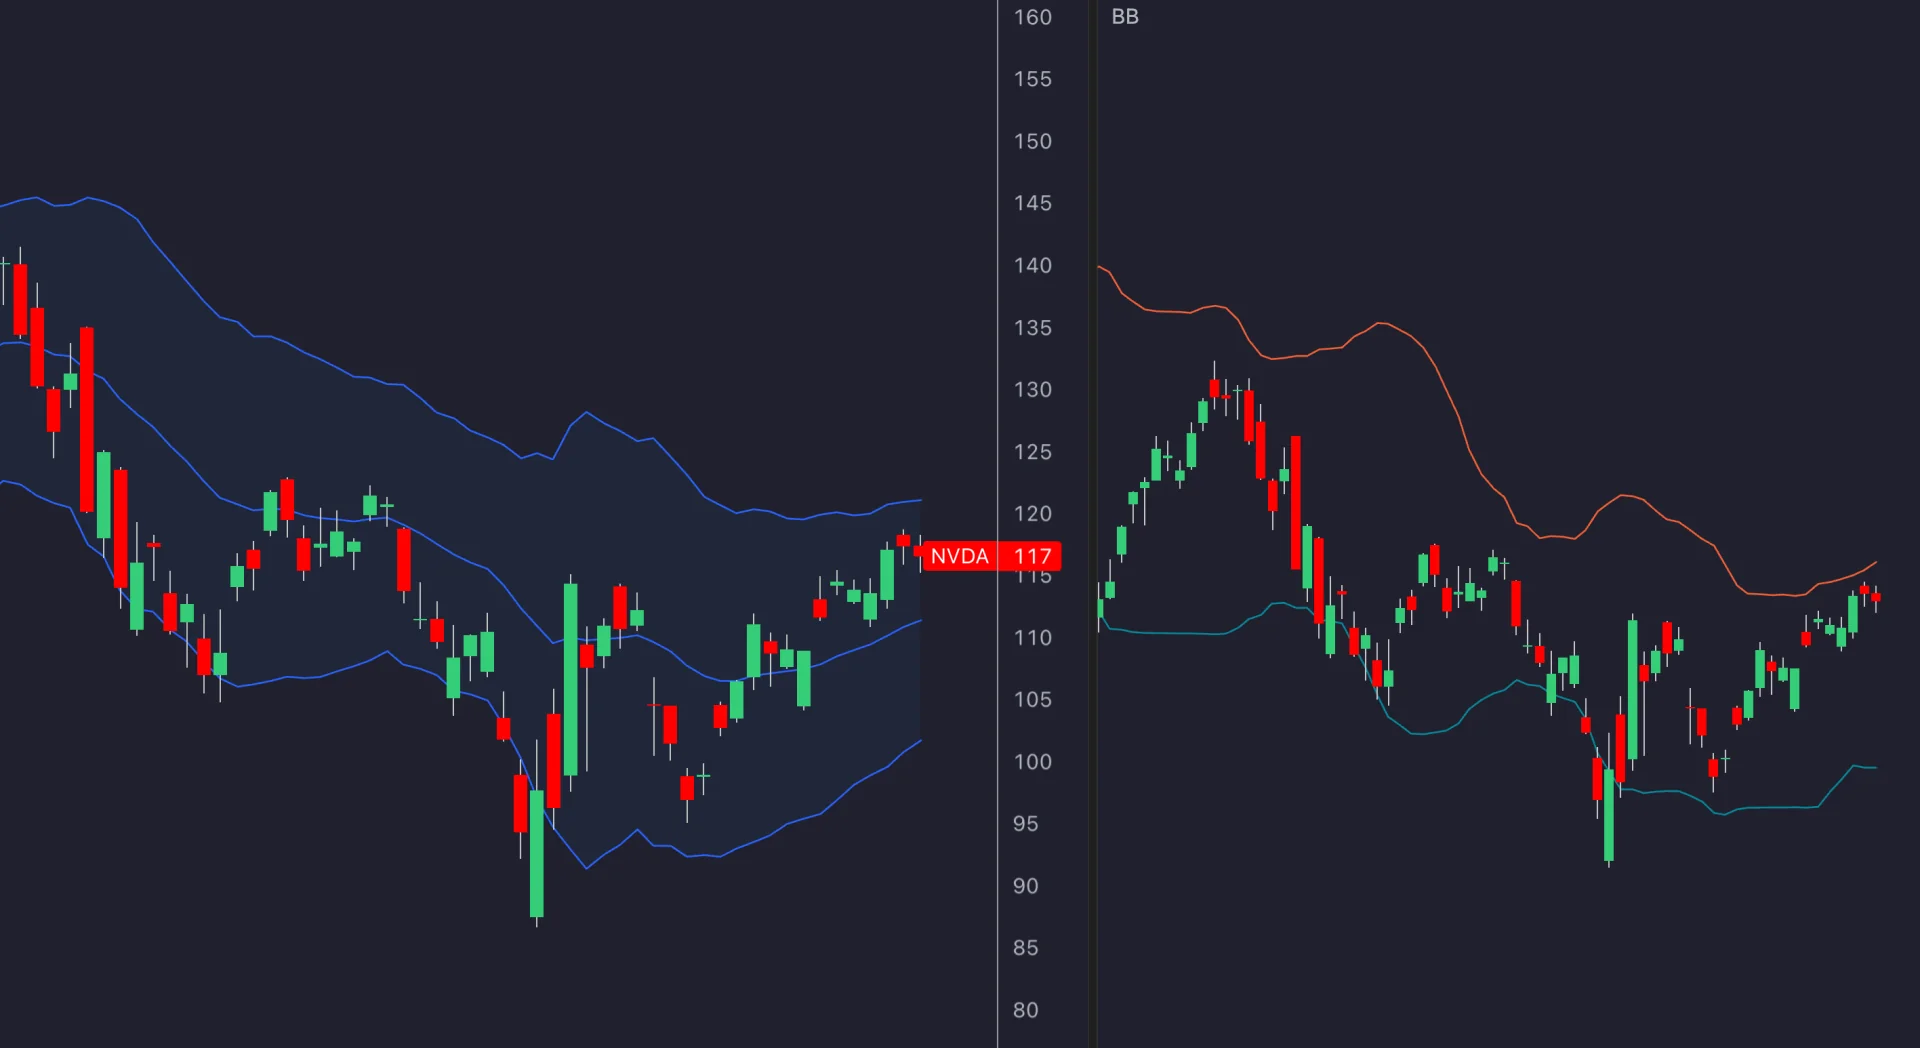
Decide whether your hypothesis is continuation or reversion. A breakout strategy might investigate completed closes outside a band. A mean-reversion strategy might require a return inside the band after an extension, together with a separately defined range condition. Compare these as different systems rather than switching explanations after seeing what price did.
Define a BB/KC Squeeze Precisely
One common squeeze definition requires both Bollinger Bands to lie inside the Keltner Channel: the Bollinger upper band is below the Keltner upper band, and the Bollinger lower band is above the Keltner lower band. Specify whether equality counts and which settings apply to each indicator.
This describes relative band placement at that moment. It is not evidence that price must break upward, that a large move must begin soon, or that every release will follow through.
For a test, you could record a squeeze only after a completed bar, then wait for a separately defined entry trigger within a fixed number of later bars. State whether a release means either Bollinger band moved outside the channel or some other condition. The squeeze, its release, and a directional price breakout are distinct events.
A close-confirmed entry should use the next executable fill assumption. A resting order at a previously known band can trigger before the current bar closes. Do not give a backtest an earlier fill at a level that was calculated only afterward.
Use Complementary Information Carefully
A momentum filter such as an RSI threshold, a price-structure condition, or a volume comparison may help answer a specific question. Test its effect rather than assuming that more indicators make a signal more reliable.
ADX describes trend strength, not direction. If direction is required, define it through price, a moving-average slope, or another explicit measure. Likewise, strong volume can accompany failed breakouts; it does not prove that a move is genuine.
Watch for redundant conditions. Price above an upper band is also above that band’s center when width is positive. Treating those as two independent confirmations overstates the information available.
Plan the Trade’s Risk Before Entering
Suppose a hypothetical share trade enters at $100 after a defined signal. A chosen invalidation stop is $97 and the target is $106. Price risk is $3 per share and potential reward is $6, giving a planned 2-to-1 ratio before costs and fill differences.
With a $300 risk budget and a $0.15 per-share cost allowance, quantity is floor($300 / $3.15) = 95 shares. Planned loss including that allowance is $299.25. If the actual entry is $101 while stop and target remain unchanged, price risk becomes $4 and potential reward $5. Recalculate the size and ratio from the actual assumptions.
A stop at an opposite band is only one candidate rule. It can create a wide risk distance, and a moving band can change that distance during the trade. Specify whether levels are fixed at entry or updated later; do not silently widen protection when volatility rises.
Use the correct point value, currency conversion, and size increments for the instrument. CME’s sizing guidance explains the link between stop distance and quantity. The SEC’s stop-order bulletin explains why a stop can fill beyond its trigger.
Build the Comparison With Quant
Choose a single market and interval, define the baseline, and ask Quant to implement the rules. Include entry timing, exits, sizing, commission, and slippage. Review the generated logic and inspect trades around band crossings, gaps, and bars that touch more than one order level.
Change one element at a time: the band type, the multiplier, an entry filter, or the exit. Keep other assumptions aligned and record how differences in holding time affect later entry opportunities. Two strategies may no longer share the same trade sample once their exits diverge.
Review average outcome, drawdown, trade count, and exposure alongside net profit and win rate. Test nearby settings and reserve later data for validation. A wider band does not automatically remove bad trades, and a narrower band does not automatically improve timing. Our out-of-sample testing guide explains how to separate parameter selection from evaluation.
Save the script, data context, parameters, and test properties with each result. A chart signal or backtest is separate from a notification and from a live broker order; verify any alert or execution connection on its own.
Video: Keltner Channels Versus Bollinger Bands
UKspreadbetting compares the two indicator types. Use the visual explanation as background, then test the specific settings and rules you intend to use.
Start With One Clear Hypothesis
Choose continuation, reversion, or a squeeze-based setup; define when it becomes actionable and when it fails. Let the evidence determine whether the additional band or filter improves that strategy rather than treating a familiar indicator combination as proof of an edge.
Read next