Breakout Trading with Support and Resistance

Breakout trading looks for price moving beyond a defined support or resistance area, potentially starting or extending a trend. The difficult part is deciding what counts as a break, when to enter, and how much a failed setup can cost. A candle crossing a level does not establish that the move will continue.
Start by marking the level before the signal, choosing an entry method, and setting an invalidation rule. Then compare results across enough market conditions to see how the approach behaves. LuxAlgo brings this workflow into a charting and AI platform: analyze levels on Quant Charts, explore relevant Library indicators, and work with Quant, our coding agent, to turn explicit rules into a strategy you can review and backtest.
- Define the level: use prior highs and lows, an anchored trendline, or a specified moving average.
- Define the trigger: distinguish an intrabar crossing, a completed close beyond the level, and a later retest.
- Use context selectively: volume, trend, and volatility filters are hypotheses to compare, not guarantees.
- Calculate exposure and risk separately: position value differs from the planned loss at a stop.
Finding Support and Resistance Levels
Support is an area where previous buying has interrupted a decline; resistance is an area where previous selling has interrupted a rise. These are observations about past price behavior. Either area can fail, and a broken resistance area may later act as support, or vice versa. Fidelity's support and resistance guide explains this role-reversal idea and the interpretive limits of technical analysis.
Three types of levels
| Type | How to define it | What to record |
|---|---|---|
| Horizontal | Prior swing highs/lows, a range boundary, or a completed session's high/low | The lookback, zone width, and when a swing becomes confirmed |
| Diagonal | A trendline anchored to selected highs or lows | The anchor bars and projected value at each decision time; do not redraw past signals using later anchors |
| Dynamic | A moving average, such as a 20-, 50-, or 200-period average | Average type, price input, period, timeframe, and whether the signal uses a completed bar |
There is no universal six-month lookback. A daily swing strategy and a five-minute intraday strategy need different definitions. Multiple touches make an area easier to identify, but do not prove it will hold or that its eventual breakout will succeed.
For a simple daily range, resistance can be the highest high of the previous 20 completed bars. Exclude the signal bar: including its own high can make a close-above-the-high condition impossible. If a later retest refers to the breakout level, freeze that level when the signal occurs instead of silently replacing it with a rolling value.
Chart tools and indicators
Moving averages help describe trend context; Fibonacci drawings provide reference levels between chosen anchors. Common retracement levels include 38.2%, 50%, and 61.8%, although 50% is a midpoint convention rather than a Fibonacci ratio. Their prices depend on the selected swing, and no percentage automatically creates resistance. LuxAlgo's native drawing tools let you mark lines and Fibonacci structures on the chart and retain them in a workspace.
How to Trade Breakouts
Spotting real versus false breakouts
A false breakout is generally identified after price crosses a boundary and returns into the prior range. At entry, that outcome is unknown. A completed close can filter out some wick-only crossings, but it delays the signal and cannot eliminate failures.
Volume offers context rather than certainty. For example, a daily strategy could require signal-bar volume to be at least 1.5 times the average of the previous 20 completed daily bars. This is a testable setting, not an established dividing line between genuine and false moves. Compare it with the same strategy without the filter. A volume spike alone cannot identify institutional participants or prove sustained demand.
Keep the data source and session consistent. Exchange-specific stock volume is not consolidated market volume; crypto volume belongs to the selected venue. On intraday charts, opening activity and quiet midday bars also make a simple recent-bar average different from a same-time-of-day comparison.
Entry and exit rules
| Method | Long example | Short example | Trade-off |
|---|---|---|---|
| Intrabar trigger | A buy-stop trigger above resistance | A sell-stop trigger below support | Can enter before the close; a wick can trigger it and execution can slip |
| Close-based signal | A completed close above resistance, followed by an order at the next available execution time | A completed close below support, followed by the corresponding short entry | A later entry can be farther from invalidation; do not assume the signal close was available as a fill |
| Retest entry | After the break, price returns to a predefined resistance zone and satisfies a specified bullish rejection rule | Price returns to broken support and satisfies a bearish rejection rule | Requires a zone, expiry, and rejection definition; the retest may never arrive |
A fixed 1–2% entry buffer can be large for one market and ordinary noise for another. If you use a percentage, tick, or ATR-based buffer, specify it before testing. Short selling also introduces borrow availability, fees, and risks that a mirrored chart rule does not capture by itself.
Place the initial stop at a price that represents your chosen invalidation, then size around that distance. A stop immediately beyond the breakout boundary is only one approach; a range boundary or volatility allowance may produce different results. The SEC's order-type bulletin explains that a stop price is not a guaranteed execution price, while a stop-limit order may not execute.
Managing trade risk: a worked example
Suppose resistance is $100, the signal closes at $100.50, and the next available entry is $101. The planned stop is $98. These illustrative prices give an initial risk distance of $3 per share.
- Planned risk budget: $150 before costs.
- Position size: $150 ÷ $3 = 50 shares, assuming whole shares and sufficient buying power.
- Position value: 50 × $101 = $5,050. This is the capital exposure, not the planned $150 stop loss.
- Illustrative 1.5R target: $101 + 1.5 × $3 = $105.50, giving $225 gross profit if all shares exit there.
- Adverse execution: if an overnight gap leads to a $95 exit, the loss is $300 before costs, exceeding the planned budget.
Commissions, spreads, and slippage reduce returns and should leave room within the risk budget. For futures and forex, include contract or point value, currency conversion, and permitted lot size. A rule described as “2% risk” normally refers to planned account loss, not putting only 2% of the account into a position; 2% is not a universally suitable risk level. Correlated positions can create substantial combined exposure.
Targets and ATR trailing stops
A 1.5R target is an example to evaluate, not a promised return. Compare a fixed target with a trailing exit as separate versions, or specify exactly how partial exits divide the position.
“Trail by 2 ATR” also needs a complete definition. One long-side research variant uses 14-period Wilder ATR and, after each completed bar, calculates the highest high since entry minus 2 ATR. The next bar's stop is the maximum of that value, the prior stop, and the initial stop, so it never moves downward. For a short, use the lowest low since entry plus 2 ATR and ratchet downward. A newly calculated stop must not apply retroactively to an earlier price within the bar that produced it.
With bar-based testing, specify the assumed sequence if the stop and target are both touched within one candle. Examine these ambiguous trades rather than automatically assigning the favorable exit. Trailing rules can reduce some open gains before exiting, and do not guarantee a profit.
Adding Context Without Overcomplicating the Strategy
Timeframe analysis
Use a higher timeframe to describe the broader trend while retaining one execution timeframe. For example, compare an intraday breakout with the most recently completed daily bar's moving-average condition. Using the final value of a daily candle before that candle has closed introduces information that was unavailable at the signal.
Alignment may change the number and distribution of trades; it does not automatically improve results. Compare the filtered and unfiltered versions on the same dates, market, costs, and execution assumptions.
Technical indicators
- RSI: describes momentum. Readings above 70 or below 30 are conventional reference levels, not universal breakout entry rules or automatic reversal signals.
- MACD and moving averages: offer trend or momentum conditions. Because both derive from price, combining them is not necessarily independent confirmation.
- Bollinger Bands: describe volatility around a moving average. A band crossing and a break of a prior swing boundary are different events.
- Volume: can compare activity with a defined baseline; distinguish total bar volume from volume at specific prices.
Common breakout patterns
Triangles compress price between converging boundaries. Wedges also converge, with both boundaries generally sloping in the same direction. Flags form a shorter consolidation after a strong directional move. These patterns organize candidate levels, but their shape does not settle the direction or profitability of the next break.
When using a pattern indicator, check how many later bars confirm each pivot and whether historical drawings are positioned back at an earlier bar. A pattern that looks obvious in hindsight was not necessarily available at its first anchor. Specify the actual detection time before translating a pattern into trades.
Research Breakouts in LuxAlgo
Compare levels and volume on Quant Charts
Keep your price boundary visible while examining where trading activity accumulated. In LuxAlgo, volume profiles provide session, rolling, and visible-range views. Session and rolling profiles require footprint data; the visible-range version uses candle volume and colors it by up/down bar direction, not buy/sell aggressor.

A profile's point of control or value-area boundary can be a separate level to study. Keep the profile window fixed when comparing examples: visible-range profiles change as you pan and zoom. In historical research, do not use a session's final levels before the session ended; use information available at the decision time, such as the previous completed session or the developing profile.
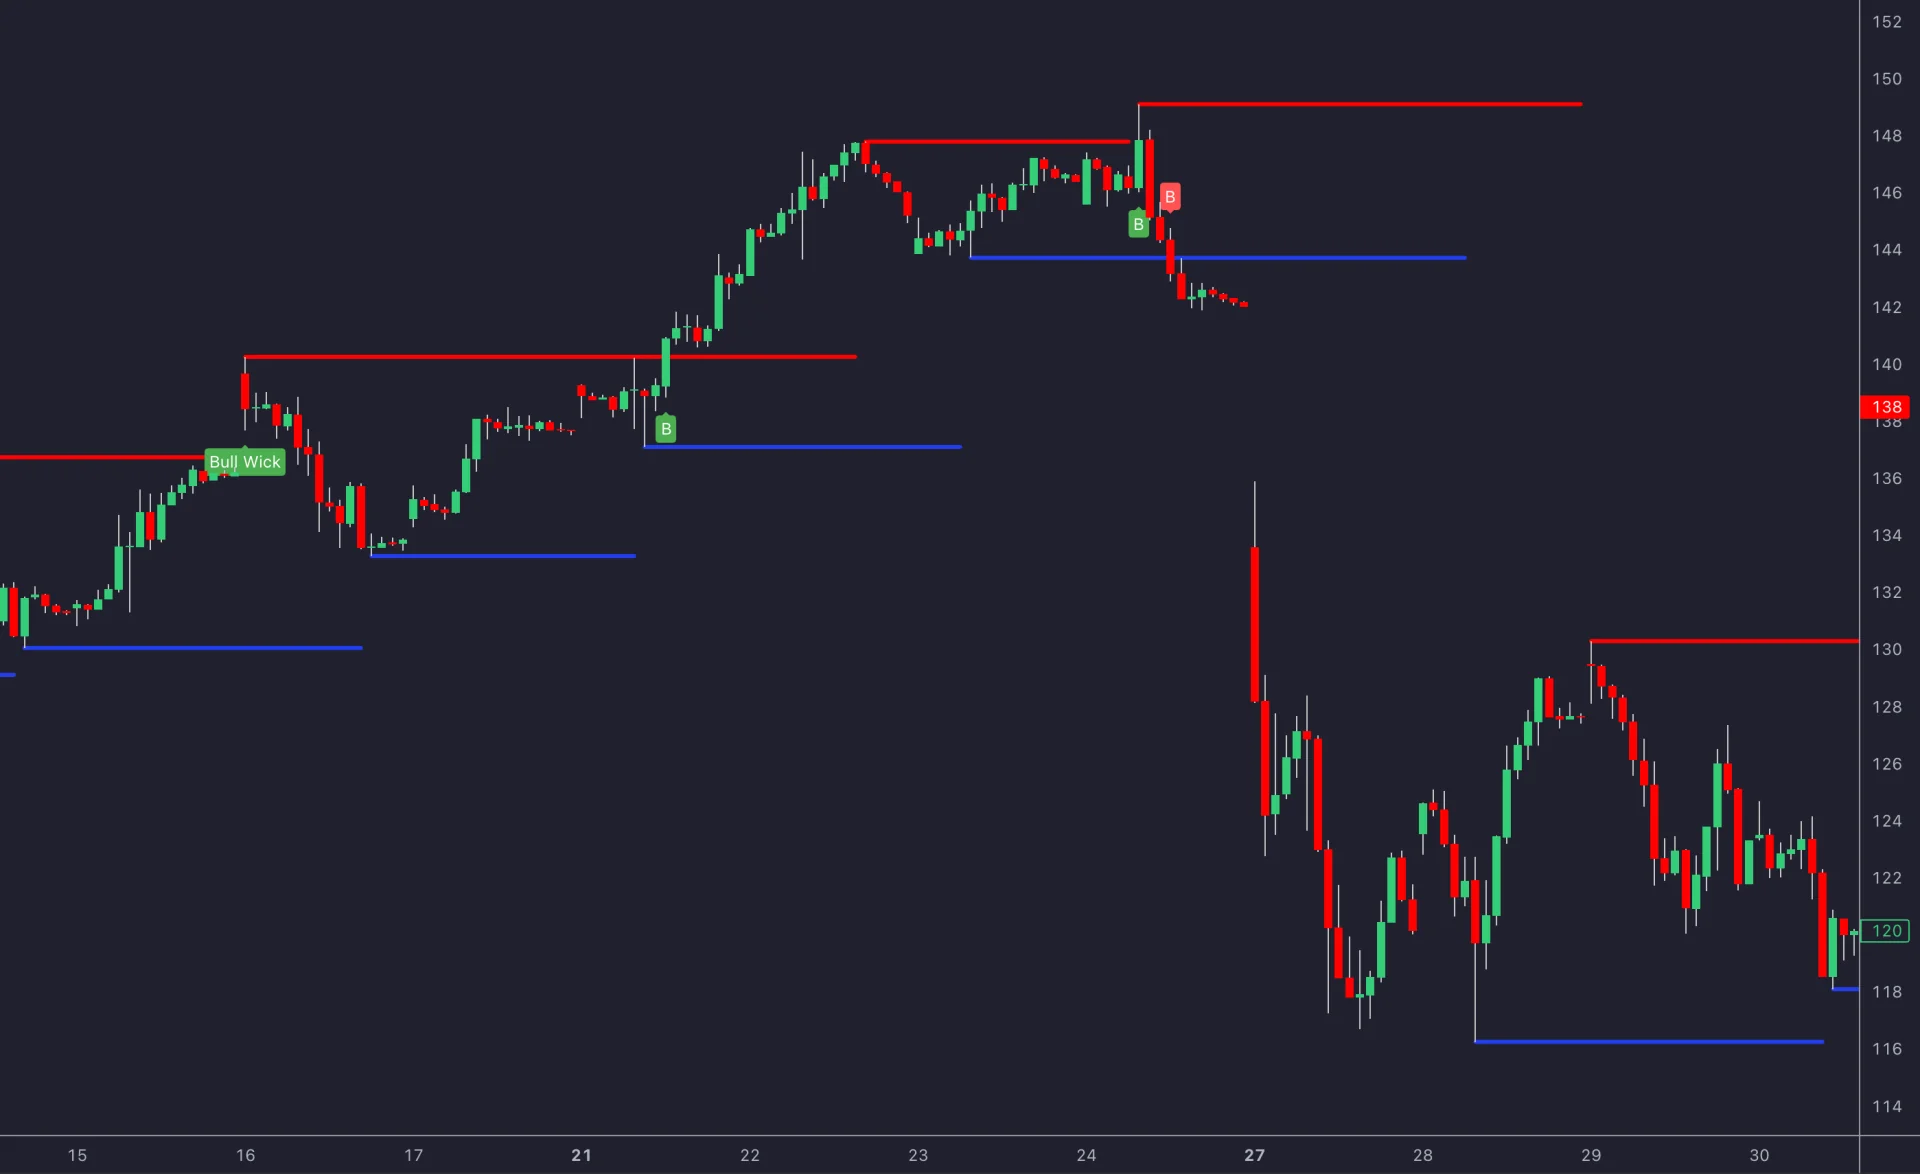
For swing-area analysis, Breakouts with Tests & Retests can be opened on Quant Charts from the Library. Its interaction labels use opens and closes; wick height participates in its swing-area definition. Its test and retest logic is specific to that indicator and differs from a simple 20-bar range breakout. Review those rules before treating labels as entries.
Turn one breakout rule into a backtest
Use Quant, our coding agent, to build a strategy from concrete conditions. Begin with a small baseline rather than combining every available indicator:
- Define the signal: on completed daily bars, while flat, signal long when the close exceeds the highest high of the previous 20 bars. Compare a version with no volume filter against one requiring 1.5 times the previous 20 bars' average volume.
- Define execution and exits: request next-bar execution, no pyramiding, and a stop fixed at the signal bar's low. Use a 1.5R target based on the actual simulated entry and that fixed stop. If the next open is already through the intended stop, model the resulting execution and immediate invalidation explicitly; do not silently discard the trade using advance knowledge of that open. These are baseline rules, separate from the $98 stop in the earlier arithmetic example.
- Specify practical details: set the symbol, session, date range, costs, position-sizing method, buying-power cap, and handling of gaps, same-bar exits, and positions still open at the end of the test.
- Review and run: inspect the generated code, run the strategy, and check example trades against the written conditions. Correct code that executes successfully but implements the wrong timing or exit logic.
- Compare results: assess trade count, net profit, drawdown, and profit factor, then examine individual fills. Reserve a later period for evaluation and track how many variations you tried.
Quant's strategy settings expose script inputs and simulation properties such as commission and slippage. The native backtest viewer lets you inspect results and trades. These are simulated outcomes; they do not establish live execution quality, and an indicator-to-strategy conversion still needs explicit entry and exit rules.
A Practical Breakout Checklist
Before evaluating a setup, record the level and when it became known, the exact signal, the earliest possible entry, the invalidation price, and the position size. Keep volume and trend filters consistent, account for costs and adverse execution, and evaluate failures alongside successful examples. Start with a clear baseline on Quant Charts, then use Quant to help investigate whether a specific change improves the evidence.
FAQs
What is the best breakout strategy?
There is no universally best breakout strategy. Compare clearly defined approaches, such as a close beyond a prior range or a breakout followed by a retest, using the same market, costs, and evaluation period. Adding confirmation filters can reduce trades without improving returns. Judge a strategy by its risk, execution assumptions, and performance on data not used to select its rules.
Which indicator is best for breakout trading?
No indicator establishes that a breakout will succeed. Prior highs and lows define price boundaries; moving averages, RSI, and MACD describe trend or momentum; volume and volatility measures add context. Choose tools that answer distinct questions, specify their rules, and compare their contribution through testing. LuxAlgo's Library and Quant Charts support that analysis, while Quant helps turn a defined idea into a reviewable strategy.
References
Read next