How Volume Affects Support and Resistance Levels

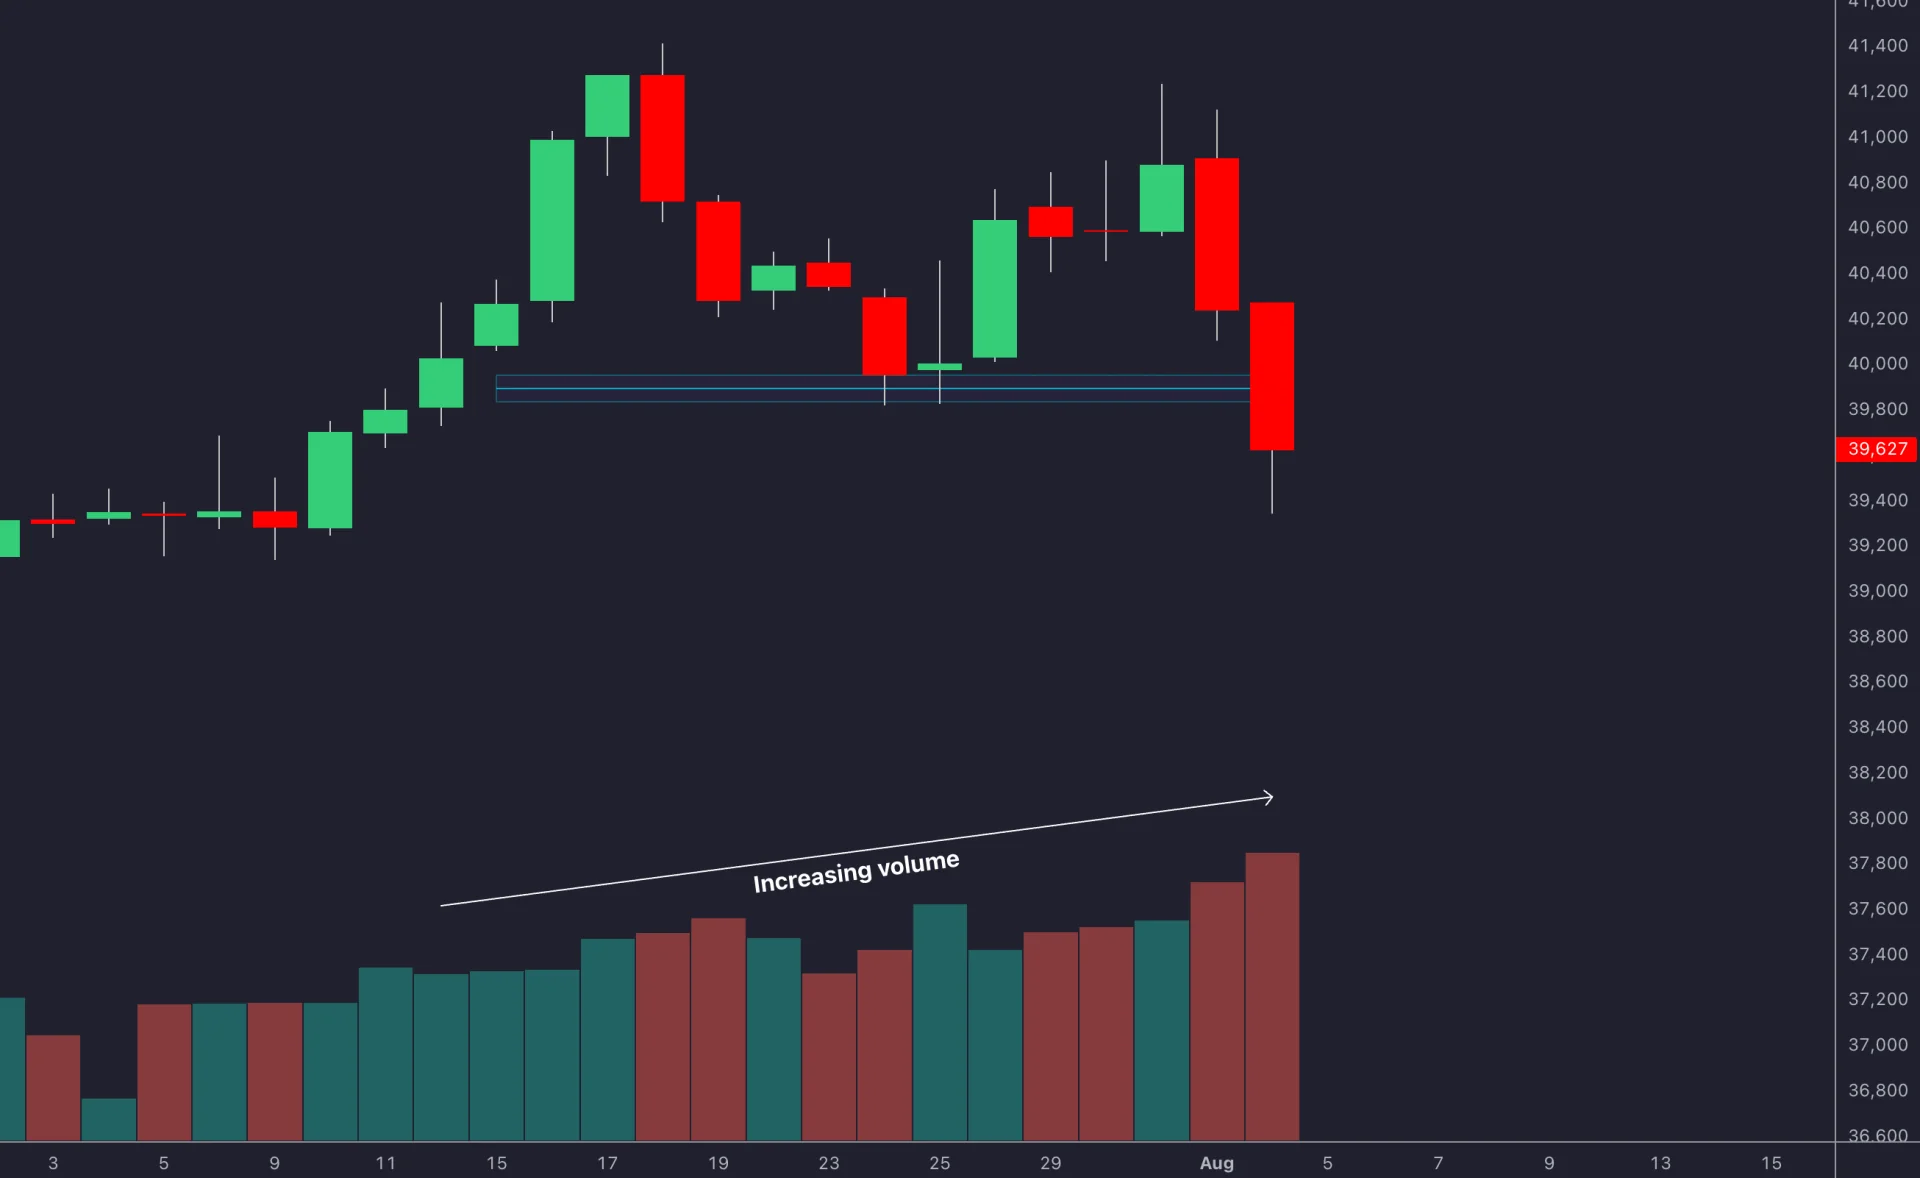
Volume shows the activity accompanying a test of support or resistance; it does not determine whether the level must hold. High volume can accompany a rejection, a breakout, or a struggle around the same price. Read the price reaction and volume together rather than treating activity as proof of strength.
Use LuxAlgo’s native charts to examine the level and its context, then work with Quant to test a clearly defined rule. The useful question is whether a volume filter improves the same entry and exit strategy after costs.
How Volume Relates to Support and Resistance
Support is an area where a decline has paused or reversed; resistance is an area where an advance has stalled or turned down. Mark those zones using information available before the current test. Historical reactions make a level worth investigating, not certain to work again.
Trading volume typically measures quantity exchanged, such as shares or contracts. It does not identify buyers’ or sellers’ motives. Check the instrument, venue, session, and units; forex tick activity is not consolidated global traded volume.
| Observation at a level | Possible interpretation | What still needs checking |
|---|---|---|
| High volume and price holds support | Substantial activity accompanied the reaction | Whether price meets the chosen entry trigger and invalidation rule |
| High volume and price breaks support | Substantial activity accompanied the breakdown | Whether the move persists or returns into the range |
| High volume and price rejects resistance | Activity increased as the advance stalled | A rejection is not automatically a profitable short setup |
| High volume and price breaks resistance | The advance attracted activity | Volume does not guarantee follow-through |
| Low volume at either level | Less reported activity against the comparison baseline | Session effects, data coverage, liquidity, and price structure |
Low activity does not necessarily mean a weak level, stability, or broad agreement on value. Likewise, repeated tests do not automatically strengthen support or resistance. A fourth test has no special status simply because three previous reactions held.
Compare Reactions Rather Than Inventing Certainty
Suppose a hypothetical ETF reaches a premarked support zone and produces two high-volume bars. If price closes back above the zone, record that reaction. If it closes below, record a breakdown. The same volume observation can occur with different price outcomes.
For a stock repeatedly testing support, compare each test’s depth, close, and subsequent recovery as well as its activity. Do not label the fourth test “confirmed support” without a defined rule and evidence of what followed.
Use Volume to Evaluate Breakouts and Reversals
Define the Volume Baseline
A completed breakout day trading 1.5 million shares against an average of 1 million over the preceding 20 sessions has 1.5 times average volume, or a 50% increase. That can be a candidate filter to test, but is not a universal minimum for a valid breakout.
Specify whether the current bar is excluded from the average. Intraday, compare equivalent times or intervals rather than an unfinished session with a full day. TradingView’s Relative Volume at Time reference explains regular versus cumulative comparisons.
Define Failure in Price Terms
A false breakout might mean a close back inside the range within a specified number of bars, or another explicit invalidation condition. Low volume alone is not that definition. High-volume breaks can fail too.
Choose whether entry requires a trade through the level, a completed close, or a later retest. If the rule needs the final daily volume, it cannot use that total for an earlier entry. See volume confirmation for breakouts for a practical framework.
Interpret Reversal Clues Carefully
A volume climax after a long move, declining activity during an advance, or a divergence between price and a defined volume indicator can prompt closer review. None guarantees a turning point. Wait for the price event your strategy requires and calculate risk from the actual entry that follows.
Plan Entries and Exits Around the Price Reaction
For a support-rejection setup, define how far price may penetrate the zone and what recovery qualifies. For a resistance breakout, define the boundary and close or retest condition. A countertrend entry after a sharp rejection needs its own tested rule; it is not justified solely by a volume spike.
Choose the invalidation before entry. A stop might sit beyond the structural zone with an explicit buffer, but “just below support” is not a complete specification. Account for tick size, volatility, spread, and the instrument’s execution behavior.
Wider Stops Require Smaller Positions at the Same Risk Budget
Increasing both stop distance and position size increases planned loss. High volume is not a reason to ignore that arithmetic. Select the stop from the trade’s invalidation, then calculate a position size consistent with the risk budget.
| Hypothetical long entry | Planned stop | Risk per share including $0.10 allowance | Shares within a $200 budget |
|---|---|---|---|
| $50 | $48 | $2.10 | 95; $199.50 planned risk |
| $50 | $47 | $3.10 | 64; $198.40 planned risk |
The allowance is an estimate for costs and adverse execution, not a cap. If you kept 95 shares after widening the stop to $47, planned risk would rise to $294.50 using the same allowance. Adding shares would increase it further.
A stop can fill beyond its trigger during a gap or fast market. A stop-limit order adds a price constraint but can remain unfilled. Review the SEC’s stop-order guidance, and include existing correlated exposure when deciding how much risk to take.
Bring Price-Level Context into LuxAlgo
LuxAlgo’s native Volume Profiles show activity across price levels. The Point of Control is the highest-volume bin; high- and low-volume regions describe the selected historical distribution. They are reference zones, not guaranteed barriers.

Visible Range uses candle data and changes with the displayed range. Session and Rolling profiles use supported footprint data. Candle-direction coloring is not the same as aggressor-side volume. Check data coverage rather than assuming every tool is available on every symbol.
Test One Additional Condition at a Time
Give Quant the level definition, entry trigger, volume baseline, stop, target, and sizing rule. Review the generated logic, particularly whether levels or swing signals require later bars. Confirm that the needed data is accessible to the script.
Use native strategy properties and results to account for commission and slippage and inspect individual trades. Compare the price-only setup with the same setup plus volume, reserve later data for validation, and examine drawdown and net performance as well as win rate.
Avoid Common Volume-Analysis Mistakes
- Reading every spike as conviction. Earnings, economic releases, auctions, and rebalancing can create unusual activity. Record the event context.
- Assuming repeated tests guarantee strength. Compare price reactions and define failure instead of counting touches alone.
- Confusing quiet activity with agreement. Low volume may reflect session patterns, limited participation, or missing data.
- Combining overlapping evidence. Moving averages, trend lines, and price patterns add context, but do not make related signals independent.
- Changing timeframes after a loss. Specify the chart interval and level lookback before testing. Intraday, swing, and position approaches need different timing and cost assumptions.
Use the volume-based support and resistance guide for more on VWAP, profile windows, and market-specific examples. The goal is a repeatable decision process, not certainty that a level will hold.
Video: Volume-Based Support and Resistance
This Coffeeshop Crypto tutorial provides another approach to identifying volume-based levels. Its indicator setup is an educational example, separate from LuxAlgo’s native tools.
References
Read next