Volume-Based Support and Resistance Explained
Volume-based support and resistance uses historical trading activity to identify price zones worth watching. A busy zone can provide context for a bounce, rejection, or breakout, but past activity does not guarantee that price will stop there.
LuxAlgo’s native charts bring Volume Profile, VWAP, and supported order-flow data into the chart workspace. Use Quant to turn a precise level-based idea into rules you can review and test, rather than treating a highlighted zone as an automatic trade.
How Volume-Based Levels Work
Traditional support and resistance focuses on previous price reactions. Volume analysis adds where activity occurred and how it changed as price approached or crossed a level. Keep that historical observation separate from a prediction about the next reaction.
| Term | Meaning | Trading implication to investigate |
|---|---|---|
| High-volume node | A relatively busy region in the selected volume profile | Price may revisit, consolidate around, reject, or move through it |
| Volume shelf | A broader area of concentrated activity | Use a zone rather than assuming one exact price will hold |
| Low-volume node or gap | A relatively quiet region in the selected historical distribution | Price may traverse it quickly, but speed and direction are not guaranteed |
| Point of Control | The highest-volume price bin in the profile | A reference that changes with range, binning, and new data |
For example, a hypothetical stock may show little historical activity between $45 and $47. That does not prove the current order book is empty there. Treat a quick move through the zone as one possible scenario and define the entry and invalidation separately.
Volume Confirmation at a Break
A break through a level accompanied by unusually high activity can be a condition to test. It is not a guarantee that the break is genuine. Define the baseline, whether the signal requires a completed close, and whether you wait for a retest.
Twice average volume means 200% of average, or a 100% increase. It is an example threshold, not a universal requirement. Intraday comparisons should account for time of day and unfinished bars; time-matched relative volume illustrates why equivalent comparison windows matter.
Choose the Chart Interval and Profile Window Separately
A scalper might examine 1–15 minute bars, a day trader 15–60 minute bars, and a swing trader 4-hour or daily bars. These are examples, not prescribed settings. A short chart interval can still display a multi-session profile, and a session profile can inform a longer-term analysis.
State the session boundaries, regular or extended hours, and whether a profile is complete or still developing. A developing POC can move before the session closes, so a backtest cannot use its final location for an earlier entry.
VWAP as Dynamic Support or Resistance
VWAP weights a selected price measure by volume over an anchored window. It is a reference for reported activity, not intrinsic value or every participant’s cost basis.
A potential support test occurs when price approaches VWAP from above and then turns upward. A potential resistance test occurs when price approaches it from below and is rejected downward. Define what qualifies as a reaction; touching or crossing the line alone does not establish an entry.
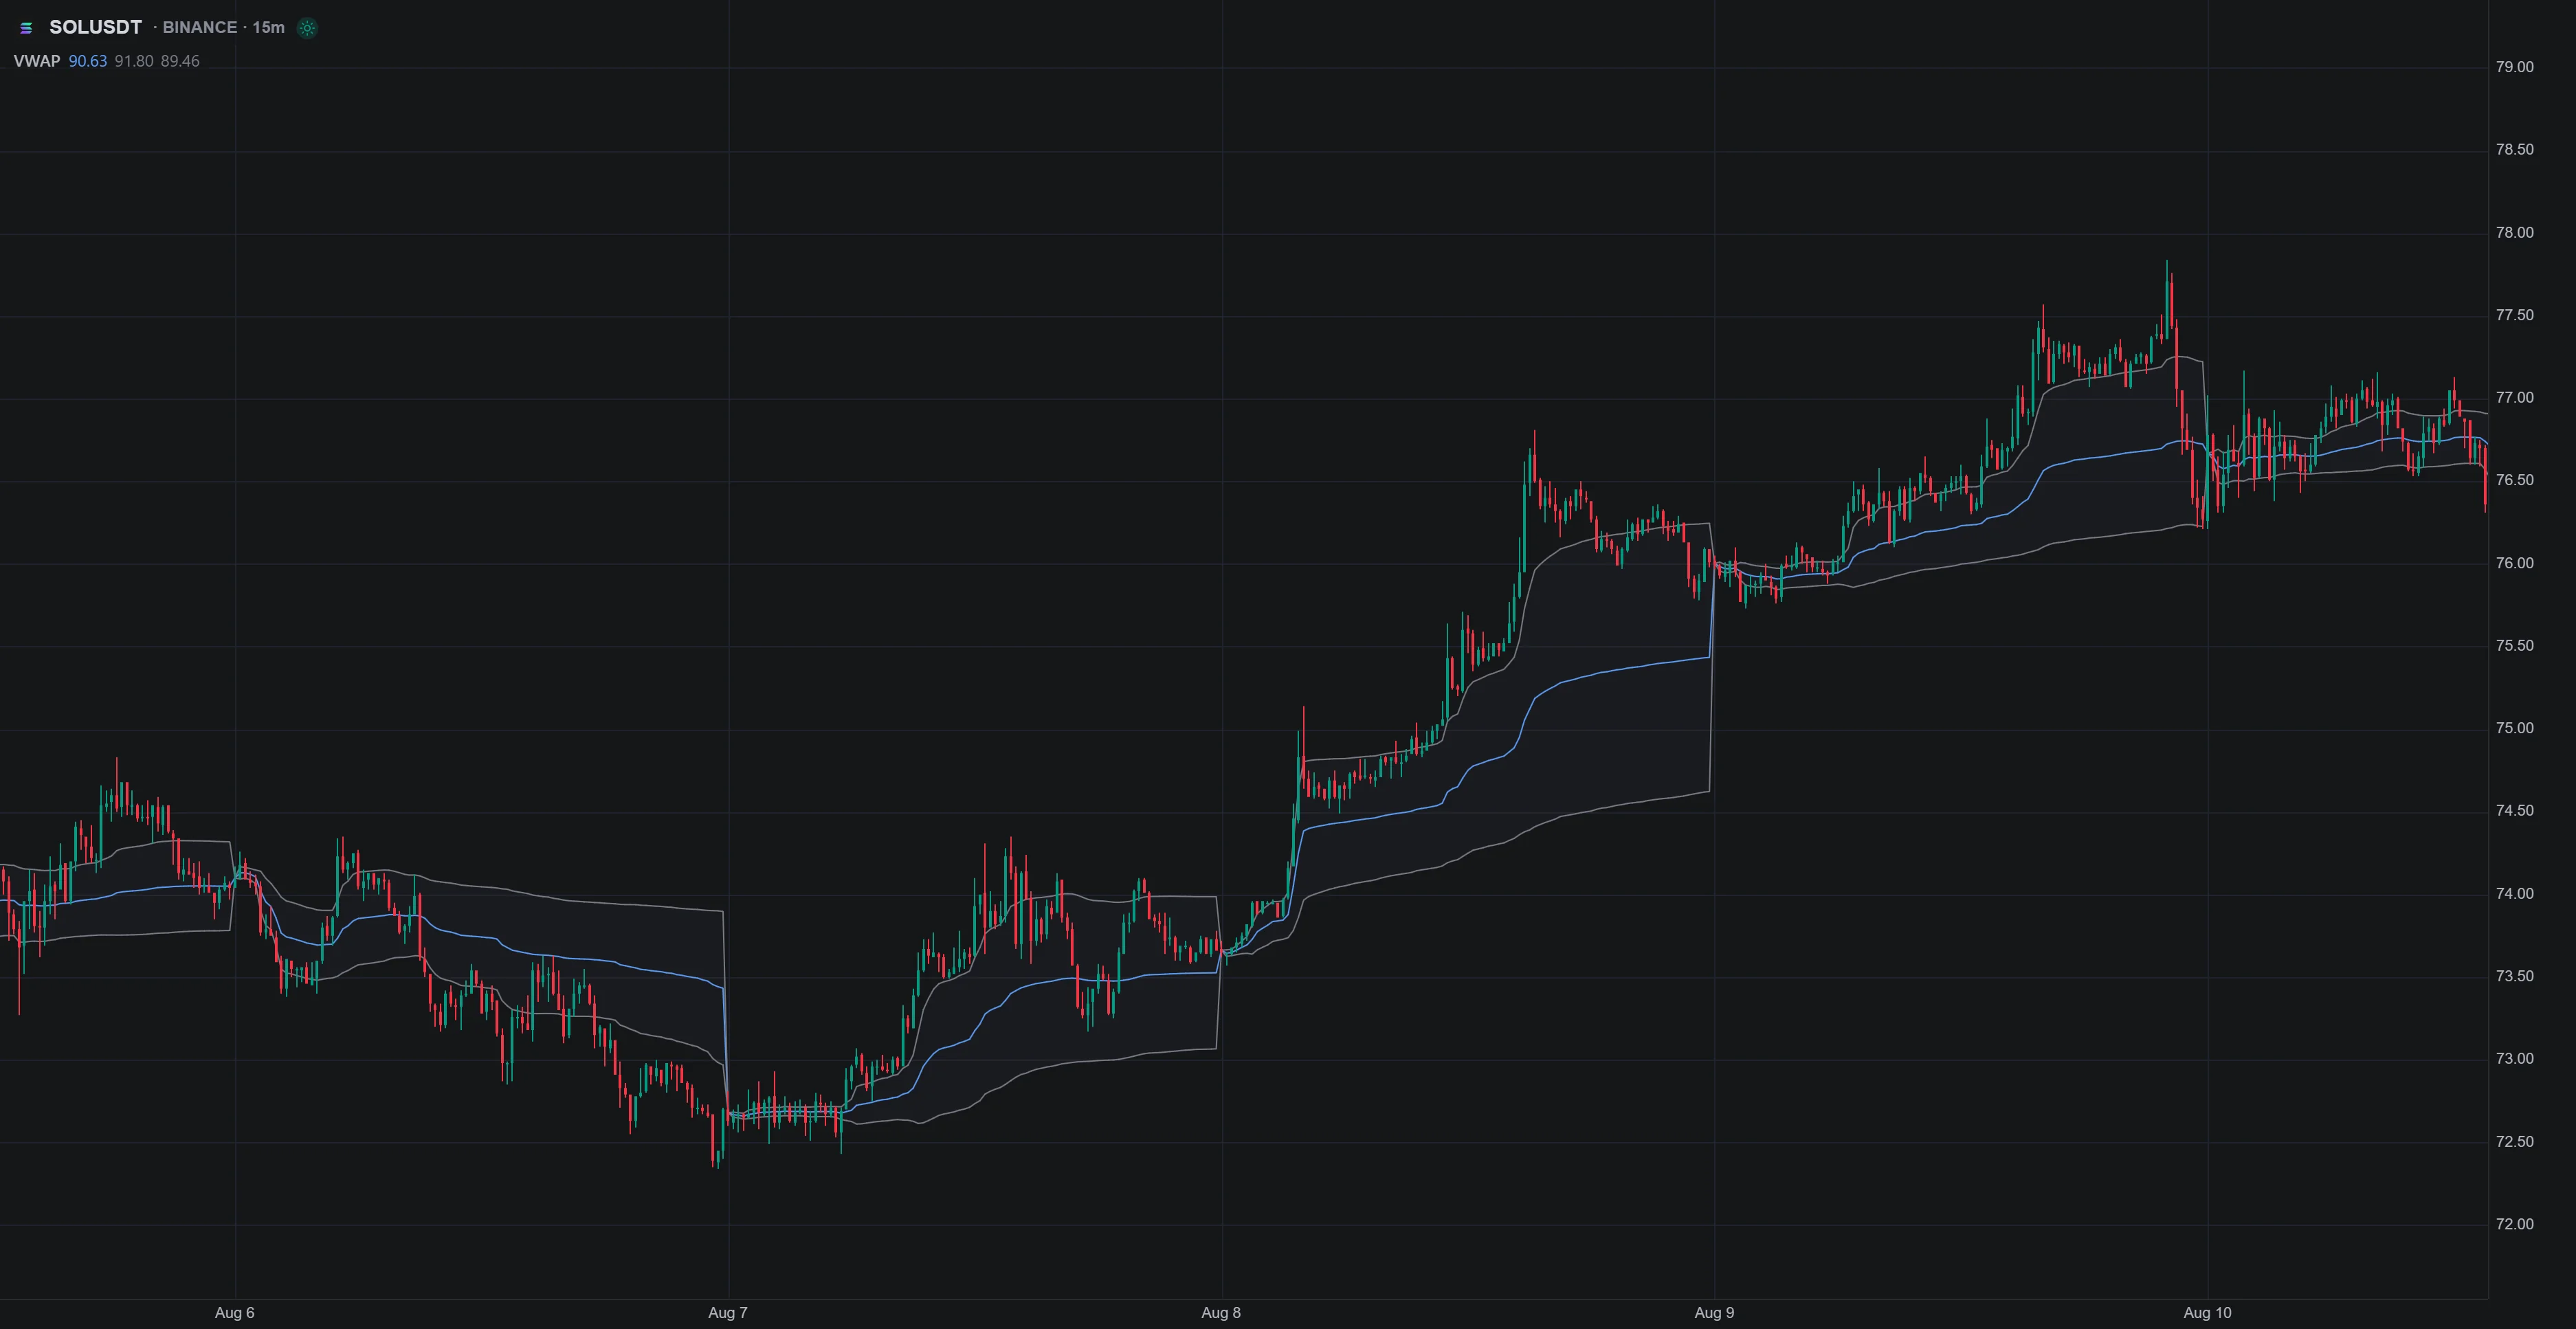
In LuxAlgo, add VWAP through Indicators → Orderflow. Day, Week, and Month anchors reset in UTC; HLC3 is the default source, with OHLC4 and Close also available. A UTC day is not automatically the same as an exchange’s regular session.
Deviation bands describe variation around that reference. A touch of a two-standard-deviation band is not an automatic mean-reversion trade, and the bands do not promise a fixed probability of containment.
Read Volume Profile Correctly
Volume Profile displays a horizontal distribution of activity across price bins. Value Area High and Low bound the selected value area, often configured around 70% of historical volume. The percentage is adjustable and is not the probability that future prices will remain inside.

LuxAlgo’s native profile types distinguish candle-based Visible Range from footprint-based Session and Rolling profiles. Visible Range changes as the displayed range changes; its up/down candle coloring is not aggressor-side buying and selling. Footprint-based profiles require supported data.
TPO is a separate time-at-price view, rather than a volume histogram. Likewise, access to a tool does not mean every symbol has identical data or history. Check market-data coverage and available lookback before comparing markets.
Use OBV for Trend Context
On-Balance Volume adds a bar’s volume when its close exceeds the previous close, subtracts it when the close is lower, and stays unchanged on an equal close. It signs the entire bar using price movement rather than measuring actual aggressive buys and sells.
Price making a lower low while OBV makes a higher low is a possible bullish divergence; higher price highs with lower OBV highs are a possible bearish divergence. Neither guarantees a reversal. OBV also does not directly map volume into price bins, so use a separate price level or profile for the proposed support or resistance.
Three Practical Trading Scenarios
Crypto VWAP Scalping
Choose a specific venue and instrument, then inspect its spread and liquidity. A familiar pair such as BTC/USDT does not guarantee smooth execution. Define the UTC anchor, band settings, and price trigger before testing a return-to-VWAP idea.
A band touch may lead to a rebound or a continuing trend. Require your chosen confirmation, specify the stop and target, and include fees and slippage. If trading derivatives, account for relevant funding and contract terms. Do not treat a historical win rate from an unspecified test as evidence for your setup.
Stock Gap Trading
Compare the gap with a profile whose range and session you have already chosen. An earlier high-volume area may provide context, but a gap can continue through it rather than reverse. Distinguish premarket activity from regular-session activity and consider the news behind the gap.
For a hypothetical $48 entry and $46.50 planned stop, price risk is $1.50 per share. With a $150 risk budget and $0.10 per share allowed for estimated costs and adverse execution, floor($150 ÷ $1.60) gives 93 shares, or $148.80 planned risk. A $51 target offers $3 gross reward per share, or 2:1 against price risk before costs. Worse fills can exceed the planned loss.
Forex Volume Analysis
Spot forex is fragmented, and a broker’s tick volume is not consolidated global traded quantity. A candle-based profile can still describe the selected feed, but it should not be presented as a universal institutional order-flow map.
Do not assume native footprint or cumulative-delta data is available for a forex symbol merely because its candles display. Confirm the source and supported tools, and keep multi-timeframe comparisons consistent with what was known at the signal time.
Build a Testable Workflow with Quant
Give Quant the precise level definition, calculation window, entry trigger, and exit and sizing rules. For example, specify whether a profile uses the prior completed session or a developing current session, and whether VWAP is anchored by UTC day or another supported period.
Review the generated logic and confirm that the data needed by the strategy is accessible. A visible chart tool is not proof that its complete internal data can be used by a custom script. Use native strategy properties and results to model costs, inspect fills, and compare drawdown and net results. Reserve later data for validation.
For alerts, define a price crossing, volume threshold, or combined condition only where your chosen tool supports it. Specify bar-close versus intrabar behavior and repeat rules. An alert notifies you; it does not guarantee broker execution. LuxAlgo Library indicators and TradingView toolkits remain distinct from native chart features.
Stops and limit orders also have different execution tradeoffs. A stop can fill beyond its trigger; a limit or stop-limit order can remain unfilled. Review the SEC’s stop-order guidance before relying on a tight level-based exit.
Video: Volume-Based Levels
This retained Coffeeshop Crypto tutorial demonstrates an approach to volume-based levels. Its indicator setup is an educational example, separate from LuxAlgo’s native tools.
FAQs
How do you use the Volume Profile for support and resistance?
Identify the POC, high- and low-volume regions, and value-area boundaries for a defined range. Treat them as zones to investigate, then specify the price reaction, entry, and invalidation. Historical volume does not guarantee that a level will hold.
How does the volume-by-price indicator work?
It groups historical volume into price bins and displays a horizontal histogram. The range, bin size, and data source affect the result. Color may reflect candle direction or another classification, so check the implementation before interpreting it as buying and selling pressure.
References
Read next