Institutional Insights: How Pros Use Algo Trading
Institutions use algorithmic trading for three distinct jobs: executing large orders without moving the market against themselves, running systematic strategies that a committee has approved and a risk desk monitors, and, for a small number of specialist firms, competing on speed. Most of what retail traders read about "how the pros trade" concerns the third job, which is the one least worth imitating, because the speed race is won by a handful of firms with exchange co-location and custom hardware. The first two jobs are where the transferable lessons live: benchmark your fills, model your costs, size positions by risk, put hard controls between the strategy and the market, and test everything before it trades. This guide separates the three, cites what is actually known about the speed race from the research that measured it, explains the execution algorithms institutions use and the controls regulators require of them, and shows which of those practices a retail trader can reproduce on Vela, our state-of-the-art charts, where Quant, our coding agent, writes and backtests the rules with costs included.
Key points:
- Speed is not the lesson. Latency arbitrage is a real and measurable business, concentrated in a few firms, and it is closed to anyone without co-located hardware.
- Execution is the lesson. Institutions slice orders against benchmarks such as VWAP and measure every fill against them; retail traders can adopt the same discipline at small size.
- Controls are mandatory, not optional. Pre-trade limits, kill switches and pre-deployment testing are written into regulation for algorithmic firms, and they are the cheapest practice to copy.
- Costs decide viability. Institutions model spread, slippage and impact before a strategy trades; the Library's Execution Cost Modeling brings the same accounting to the chart.
Video: A Hedge Fund CIO Explains Quantitative Trading
Business Insider's interview with a hedge fund chief investment officer on what quantitative trading is and how a systematic fund operates. It is a useful, non-technical picture of the second job described above: strategies designed, approved and monitored as a process.
What Institutions Actually Do
| Activity | Who does it | What the algorithms do | Transferable to retail? |
|---|---|---|---|
| Execution | Asset managers, banks' agency desks, brokers | Slice large parent orders into child orders against a benchmark (VWAP, TWAP, participation, implementation shortfall) to limit market impact | Yes: the benchmarking and cost discipline |
| Systematic strategies | Quantitative hedge funds, CTAs, asset managers | Run researched, approved rules across many markets with risk limits, monitoring and scheduled review | Yes: the process, at smaller size and lower frequency |
| Market making | Specialist electronic market makers | Quote both sides continuously, manage inventory, hedge across venues | Rarely: requires low latency and venue access |
| Latency arbitrage and HFT | A small number of proprietary firms | React to price changes on one venue before quotes update on another, within microseconds | No: closed to anyone without co-location and custom hardware |
| Risk and compliance overlay | Every regulated algorithmic firm | Pre-trade checks, position and loss limits, kill functionality, testing and audit trails | Yes, and it is the cheapest practice to copy |
The Speed Race, Measured
The best evidence on high-frequency trading comes from a study by Aquilina, Budish and O'Neill, published by the UK Financial Conduct Authority and the Bank for International Settlements, which used exchange message data, including the failed orders that ordinary order-book data omit, to observe latency-arbitrage races directly. In FTSE 100 stocks they found races roughly once a minute per symbol, with the typical race lasting five to ten millionths of a second, and races accounting for about a fifth of trading volume. Participation was concentrated, with the top six firms on both sides of more than four fifths of all race wins and losses. Each race was worth only about half a tick, but the volumes were large enough that the authors put the sums at stake at around five billion dollars a year in global equities, and estimated that eliminating latency arbitrage would cut the market's cost of liquidity by roughly a sixth.
Two conclusions follow for everyone else. The race is real, and it is not a market a retail trader, or most institutions, can enter; the infrastructure involved is covered in our guides to latency standards in trading systems and high-frequency trading in 2026. And the half-tick-per-race economics explain why every other participant obsesses over execution: the cost of being on the wrong side of those races is paid through the spread and price impact, which is exactly what execution algorithms and cost models are built to manage.
Execution Algorithms and Their Benchmarks
Large orders move prices against themselves. Submitting institutional size at once consumes the visible book and signals intent, so execution desks work a parent order into the market as a stream of smaller child orders, each algorithm defining the benchmark it is judged against. The Library's TWAP, VWAP and POV execution entry covers the mechanics and trade-offs.
| Algorithm | How it schedules | Benchmark | Trade-off |
|---|---|---|---|
| TWAP | Even slices across a time window | Simple average price over the window | Predictable but ignores liquidity and is easy for others to detect |
| VWAP | Slices in proportion to the expected intraday volume curve | The session's volume-weighted average price | Trades where liquidity usually is, but depends on the assumed volume profile |
| POV (participation) | Targets a fixed share of whatever volume prints | Share of volume achieved | Adapts to conditions but has no fixed completion time and chases volume spikes |
| Implementation shortfall | Balances impact against the risk of price drifting away from the decision price | Decision price when the order was created | The most complete measure of cost, and the hardest to optimise |
The benchmark is the transferable idea. Session VWAP has practical gravity intraday precisely because so many desks are measured against it; our guides to VWAP entry strategies and the TWAP benchmark show how retail traders use the same lines, and market makers 101 explains the other side of the book.
Infrastructure and Code
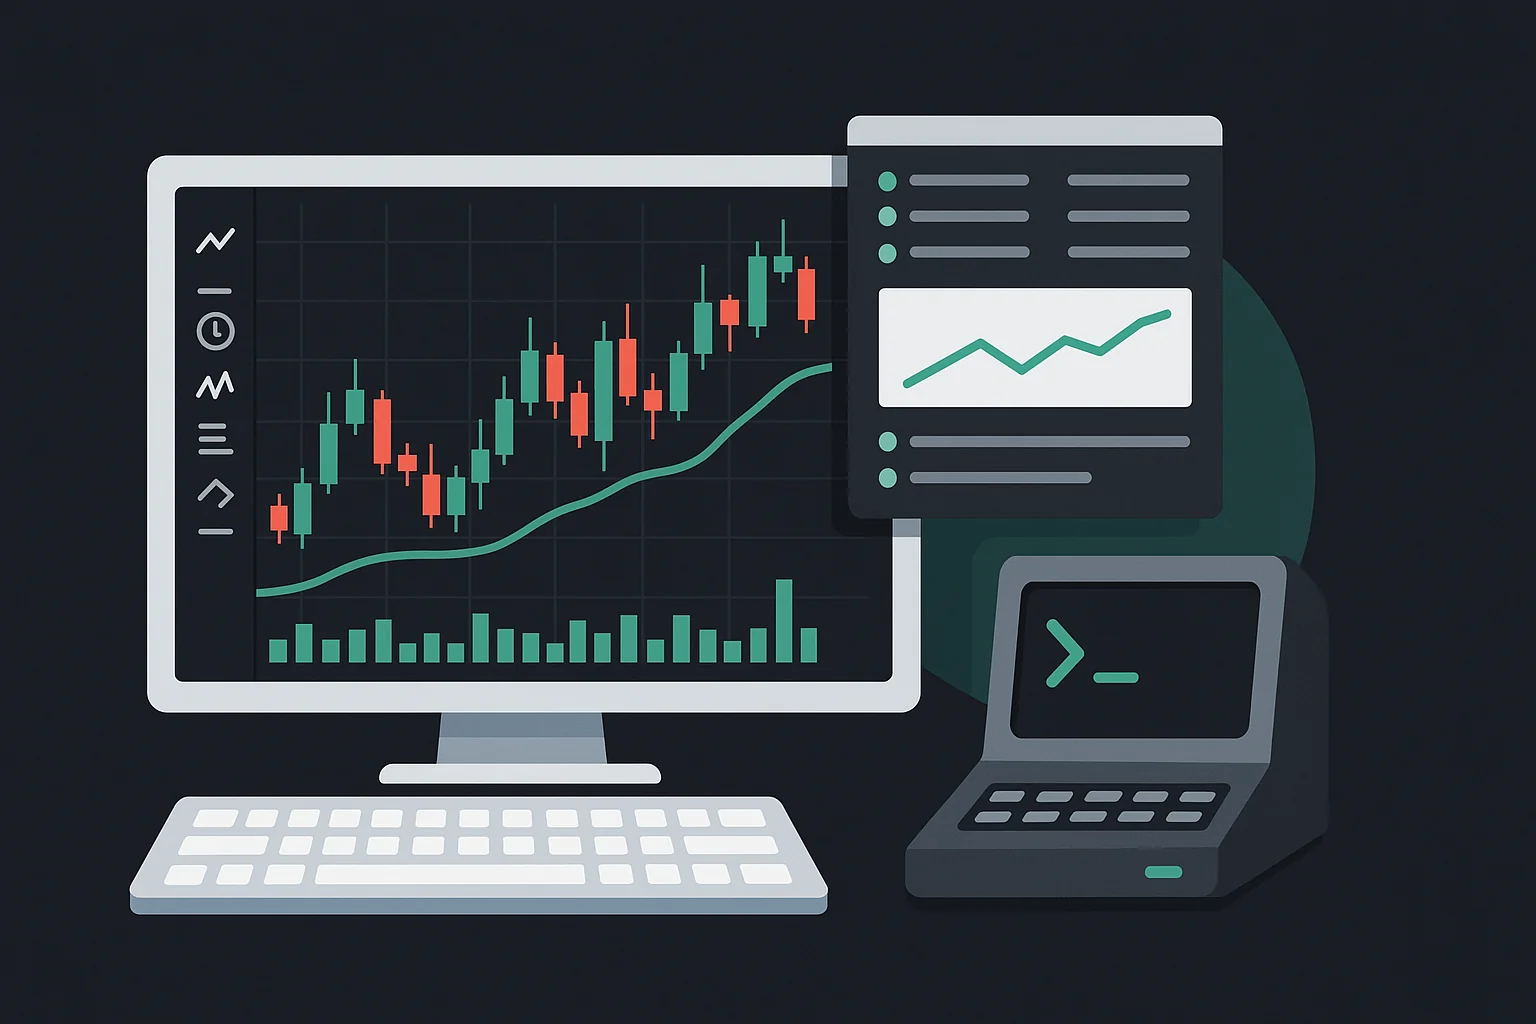
An institutional trading stack separates concerns that a retail setup usually merges: market data handling, strategy logic, an order management system that tracks every order's state, an execution management system that routes child orders to venues, and a risk layer that can veto or halt any of it. Speed-critical components are written in C++ or run on programmable hardware; research, backtesting and monitoring are written in Python; and the two are connected by well-defined interfaces so a research model never talks to an exchange directly. Our guide to the best programming languages for algorithmic trading covers where each language fits. The architectural lesson for a retail trader is the separation itself: keep the rule that generates signals, the code that places orders and the limits that can stop it as three distinct things.
Risk Controls Regulators Require
For algorithmic firms in the European Union, the controls are written down. Commission Delegated Regulation 2017/589, the MiFID II technical standard known as RTS 6, requires firms engaged in algorithmic trading to test algorithms before deployment and after material changes, to run pre-trade controls including price collars and maximum order values and volumes, to monitor positions and losses in real time, to be able to cancel all outstanding orders immediately with kill functionality, and to review and self-assess the whole arrangement annually. US market-access rules impose comparable pre-trade risk controls on broker-dealers. The reasons are historical: the 2010 flash crash, in which US equity indices fell and recovered within minutes as algorithms withdrew liquidity, and the 2012 Knight Capital incident, in which a faulty software deployment sent erroneous orders for most of an hour and cost the firm a pre-tax loss reported at around 440 million dollars, both made the case that a strategy needs something outside itself that can stop it.
| Institutional control | What it does | Retail equivalent |
|---|---|---|
| Pre-trade checks | Rejects orders outside price collars, size limits or message-rate limits before they reach the venue | Broker-side maximum order size and price limits; a sanity check in your own code |
| Position and loss limits | Caps exposure per strategy and per desk, with automatic flattening at thresholds | Daily loss limit and maximum position size enforced by the platform or broker, not by willpower |
| Kill functionality | Cancels all orders and halts all algorithms on one command | Know how to flatten and disable every automated process in under a minute, and rehearse it |
| Pre-deployment testing | Backtests, conformance testing against the venue, and staged rollout | Backtest with costs, then paper trade, then trade small |
| Monitoring and audit trail | Real-time dashboards and a record of every order and decision | A journal of every trade with the reason it was taken and the fill against the benchmark |
| Periodic review | Annual self-assessment of algorithms, controls and governance | A scheduled review of each strategy's live performance against its backtest |
Cost Modelling Before Trading
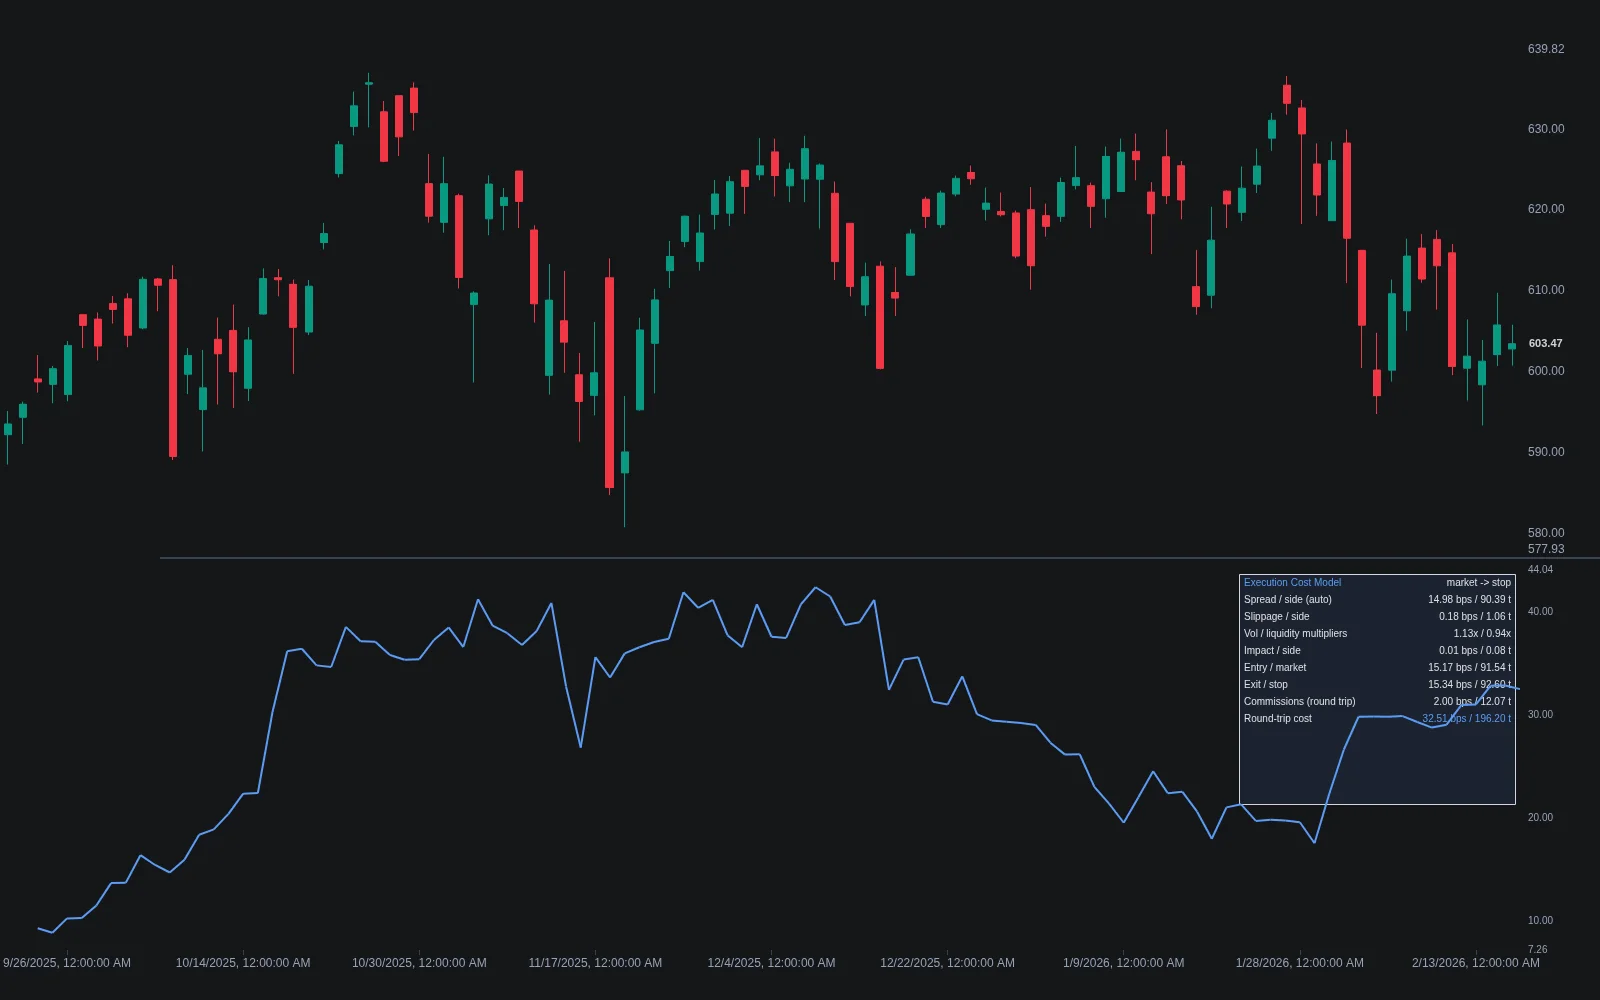
Institutions do not trade a strategy until they know what it will cost to run. The components are spread paid when crossing the book, slippage between decision and fill, commissions and fees, partial fills, and, for large orders, the price impact of the order itself, which grows with size relative to available liquidity. The Library's execution cost modeling entry sets out the accounting and the Execution Cost Modeling indicator plots it as a chart series, charging crossing sides half the spread plus conditioned slippage and commissions and pricing resting limit orders by fill probability instead. The viability screen is the institutional habit worth copying: compare a strategy's gross profit per trade in ticks with its modelled round-trip cost, and if the edge does not clear the cost with room to spare, the strategy is not ready. Our guide to backtesting limitations, slippage and liquidity covers the same ground from the backtester's side.
What Transfers to Retail
| Institutional practice | Why it works | How a retail trader applies it |
|---|---|---|
| Benchmark every fill | Makes execution quality measurable | Record each fill against session VWAP or the decision price; use limit orders where the cost of missing is lower than the spread |
| Model costs first | Kills unviable strategies before they lose money | Set commission and slippage in the backtest; screen gross edge per trade against round-trip cost |
| Size by risk, not conviction | Keeps any single trade from mattering too much | Fixed fractional or volatility-scaled sizing with a hard daily loss limit |
| Separate signal, execution and control | A failure in one layer cannot take the others down | Signal rules on the chart, order placement at the broker, limits enforced by the platform |
| Test in stages | Catches errors before they are expensive | Backtest with costs, walk forward, paper trade, then trade small |
| Review on a schedule | Strategies decay and regimes change | Compare live results with the backtest monthly and retire what has stopped working |
What does not transfer is speed. A retail order travels through a broker to a venue in milliseconds at best, against competitors operating in microseconds, so any strategy whose edge depends on reacting first is not available. Strategies that hold for hours to weeks, size sensibly and pay attention to costs are, and they are the ones most systematic funds actually run. Our comparison of algorithmic and traditional trading and algo trading and market liquidity give the wider context.
Where Vela Fits
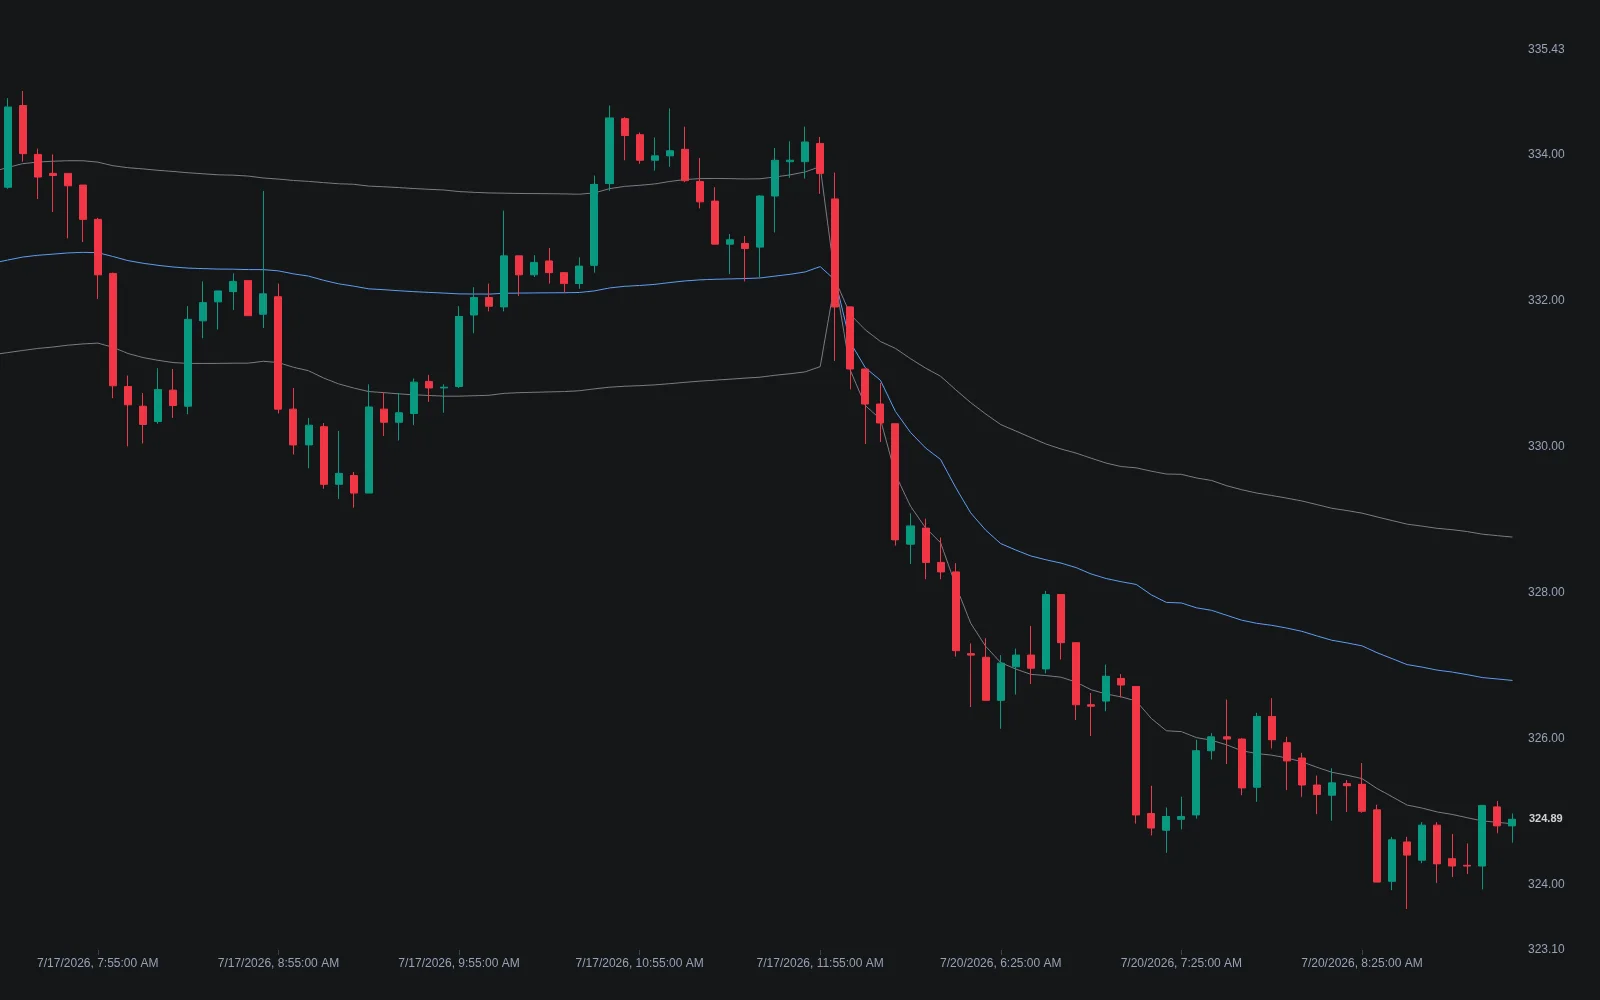
Vela gives a retail trader the institutional benchmarks and the cost accounting without the institutional infrastructure. The Library's VWAP, with session, weekly and monthly anchors and deviation bands, and the anchored VWAP and volume profile concepts put the execution benchmarks on the chart; the Execution Cost Modeling indicator puts the cost model beside them; and for the crypto venues and US equities listed in the data documentation, order-flow footprints show executed volume at price with per-side trade counts, the pre-aggregated view of what institutional desks read from the tape, covered in our guide to heatmaps and footprints. Describe a rule to Quant, buy pullbacks to session VWAP only while price holds above the daily anchored VWAP, with a stop one deviation band below and a risk-based position size, and Quant writes it in Pine Script on the active chart. Open Code to read the logic, click Run, and the Backtest Summary reports net profit, trade count, win rate, maximum drawdown and profit factor with commission and slippage set in the strategy properties, which is the institutional cost discipline applied before a single order is placed. The Making Strategies with Quant guide shows the workflow, and the Journal imports fills from connected broker accounts, refreshed daily or on demand, and paints the trades on the chart so live fills can be compared with the benchmark.
One boundary. The LuxAlgo platform does not place orders for you; Vela is where rules are written and tested, and execution stays with your broker, where the pre-trade limits in the table above should live.
Conclusion
Institutions use algorithms mostly to execute well and to run approved strategies under supervision, and only a few of them to race. The race is measurable, concentrated and closed; the rest is a set of habits: benchmark fills, model costs before trading, size by risk, keep signal, execution and control separate, test in stages and review on a schedule, with regulation making those habits mandatory for firms. Every one of them is available to a retail trader at small size, and the benchmarks and cost models involved are on Vela, where Quant writes the rule and the Backtest Summary judges it with costs.
Key Takeaways
- Three jobs, one worth ignoring. Execution and supervised systematic strategies transfer; the microsecond race does not.
- The arms race is measured. Races about once a minute per FTSE 100 stock, a fifth of volume, six firms on most of it, half a tick each, around five billion dollars a year globally.
- Benchmarks and costs first. VWAP and TWAP for fills, a round-trip cost model for viability, before any strategy trades.
- Controls are regulation for firms. RTS 6 requires testing, pre-trade limits, real-time monitoring and kill functionality; copy the structure.
- On Vela: VWAP, volume profile, Execution Cost Modeling and footprints on the chart; Quant writes the rule; the Backtest Summary reports it with costs; no LuxAlgo tool places orders.
FAQs
How do institutions use algorithmic trading?
Mainly for execution, slicing large orders into smaller ones against benchmarks such as VWAP, TWAP or implementation shortfall to limit market impact, and for running systematic strategies under risk limits and monitoring. Electronic market making and latency arbitrage are the province of a small number of specialist firms with co-located, custom hardware.
What is high-frequency trading and how big is it?
Trading that reacts to market events within microseconds. A study by Aquilina, Budish and O'Neill using exchange message data found latency-arbitrage races roughly once a minute per FTSE 100 stock, accounting for about a fifth of volume, with the top six firms involved in more than four fifths of races, each worth about half a tick, and total stakes around five billion dollars a year in global equities.
Can retail traders copy institutional strategies?
The habits, yes: benchmarking fills against VWAP or the decision price, modelling spread, slippage and commissions before trading, sizing positions by risk, separating signal logic from order placement and from hard limits, testing in stages and reviewing on a schedule. Speed-dependent strategies cannot be copied, because retail orders travel in milliseconds against competitors operating in microseconds.
What risk controls do algorithmic trading firms need?
In the European Union, MiFID II's RTS 6 requires pre-deployment and post-change testing, pre-trade controls such as price collars and maximum order sizes, real-time position and loss monitoring, kill functionality that cancels all orders and halts algorithms immediately, and annual self-assessment. US market-access rules impose comparable pre-trade controls on broker-dealers. The 2010 flash crash and the 2012 Knight Capital incident are the cases behind these rules.
What is VWAP and why do institutions use it?
The volume-weighted average price of everything traded since an anchor, usually the session open. Execution desks are often measured against it, so a VWAP algorithm distributes child orders in proportion to the expected volume curve to finish near the session average. That is why the line has practical gravity intraday and why retail traders use it as a bias and mean-reversion reference.
How does Vela support institutional-style trading?
The Library's VWAP with anchors and deviation bands, anchored VWAP and volume profile provide the benchmarks; Execution Cost Modeling estimates round-trip cost on the chart; footprints show executed volume at price for supported venues. Describe a rule to Quant, read the Pine Script in Code, click Run, and the Backtest Summary reports the result with commission and slippage. The Journal imports broker fills for comparison. No LuxAlgo tool places orders.
References
LuxAlgo Resources
- Vela
- LuxAlgo Quant
- Making Strategies with Quant
- Vela Data Documentation
- Order Flow Documentation
- Journal Documentation
- VWAP Indicator
- Execution Cost Modeling Indicator
- Session VWAP Concept
- Anchored VWAP Concept
- Volume Profile Concept
- TWAP, VWAP and POV Execution Concept
- Execution Cost Modeling Concept
- Latency Standards in Trading Systems
- The Millisecond Manifesto: High-Frequency Trading in 2026
- VWAP Entry Strategies for Day Traders
- Time-Weighted Average Price (TWAP) Price Benchmark
- Market Makers 101: Liquidity and Influence
- Best Programming Languages for Algorithmic Trading
- Backtesting Limitations: Slippage and Liquidity Explained
- Heatmaps and Footprints: Visual Market Tools
- Algorithmic Trading vs Traditional Trading: Key Differences
- Algo Trading and Market Liquidity: Friend or Foe?
External Resources
- Aquilina, Budish and O'Neill — Quantifying the High-Frequency Trading "Arms Race" (BIS Working Paper 955)
- FCA Occasional Paper 50 — Quantifying the High-Frequency Trading "Arms Race" (PDF)
- Wikipedia — High-Frequency Trading
- Wikipedia — Volume-Weighted Average Price
- Wikipedia — Implementation Shortfall
- EUR-Lex — Commission Delegated Regulation (EU) 2017/589 (MiFID II RTS 6)
- Wikipedia — 2010 Flash Crash
- Wikipedia — Knight Capital Group
Read next