MACD Crossovers in Trending vs. Ranging Markets
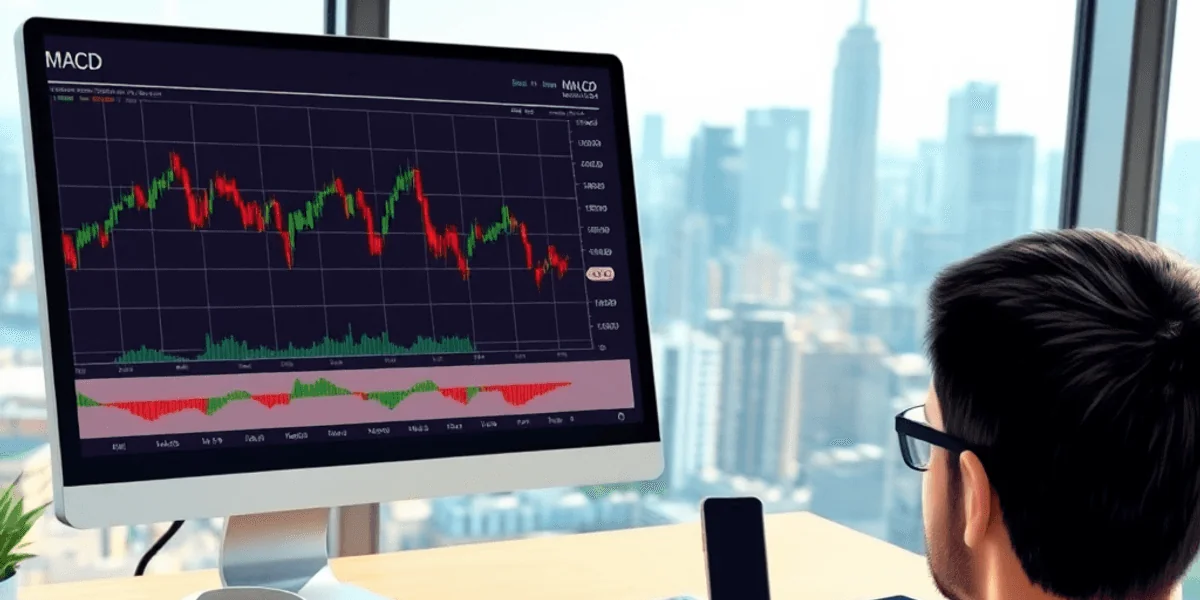
MACD crossovers are among the oldest objective momentum signals on a chart, and their reputation swings with the market. In a trend they look like the cleanest entry there is. In a range they fire constantly and lose money on most of the fires. That behaviour is not a flaw in the indicator so much as a consequence of how it is built, and understanding the construction explains exactly when a crossover is worth acting on and when it is noise. This guide sets out how MACD is calculated, what its three signals mean, why the same signal behaves so differently in trending and ranging conditions, how to classify the regime before trading a cross, and how to test the whole thing with Quant in Quant Charts. It replaces the accuracy percentages that circulate on this topic with what the LuxAlgo Library actually documents.
How MACD Is Built
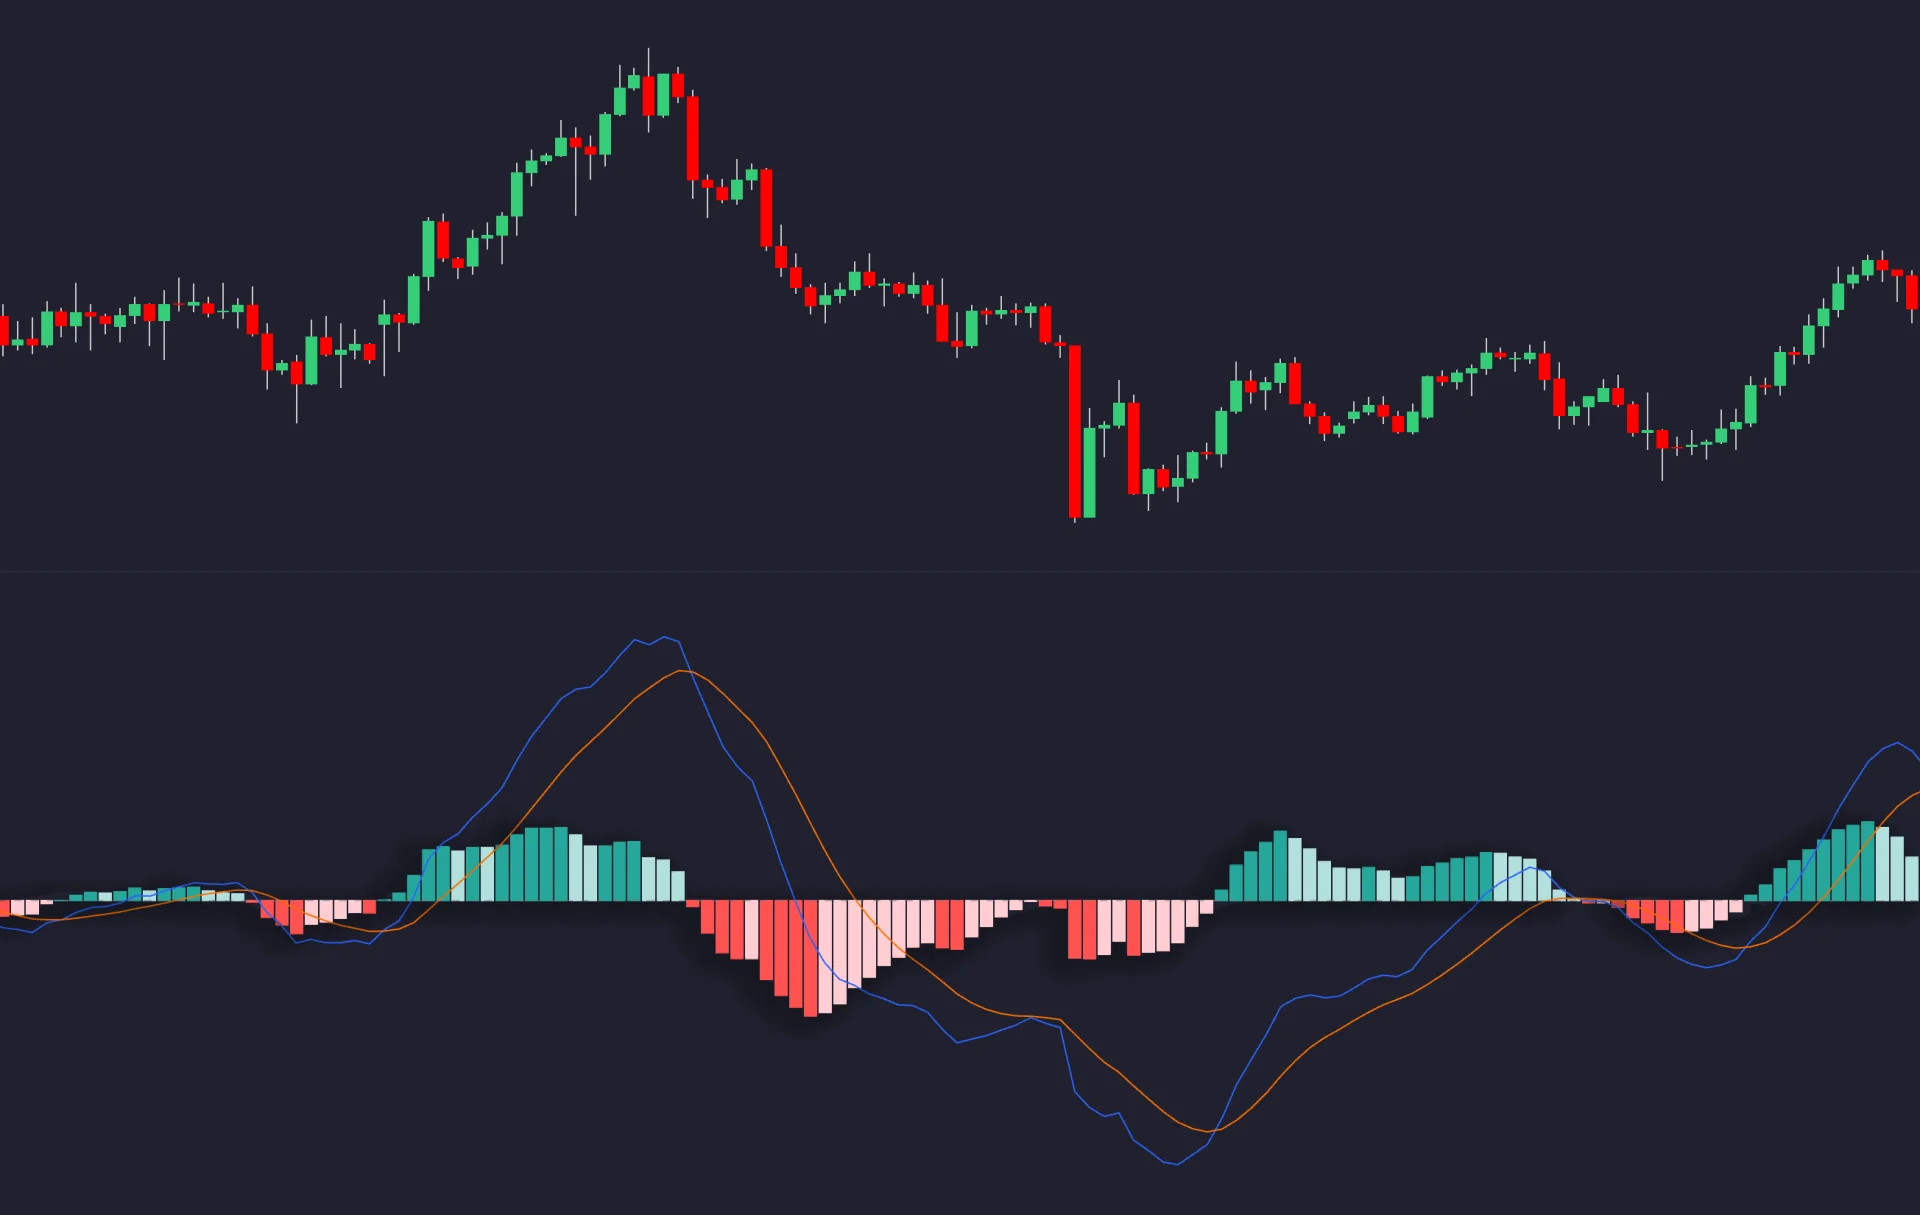
The LuxAlgo Library's MACD entry gives the construction. The MACD line is the 12-period exponential moving average of price minus the 26-period EMA. The signal line is a 9-period EMA of the MACD line itself. The histogram, added by Thomas Aspray in 1986 to Gerald Appel's original late-1970s design, plots the gap between the two. Everything the indicator says comes from those three series, and the Library is precise about the order in which they speak.
- Zero-line cross. The slowest reading. MACD above zero means only that the 12 EMA is above the 26 EMA, a trend statement equivalent to a moving average crossover.
- Signal cross. Faster. The MACD line crossing its own 9-period average marks momentum turning relative to its recent path.
- Histogram inflection. The earliest. Shrinking bars show the spread narrowing before any cross prints, so the first smaller bar after a run of expansion flags fading thrust.
Two structural facts follow. MACD is lagging by construction, since every component is an EMA of past prices; the histogram is earliest only because it differentiates the spread. And its values are denominated in price, so a reading of 2 means nothing across instruments or across one instrument's history, which is why the Library points to the PPO and the volatility-normalised MACD-V for comparable levels.
Why the Regime Decides the Outcome
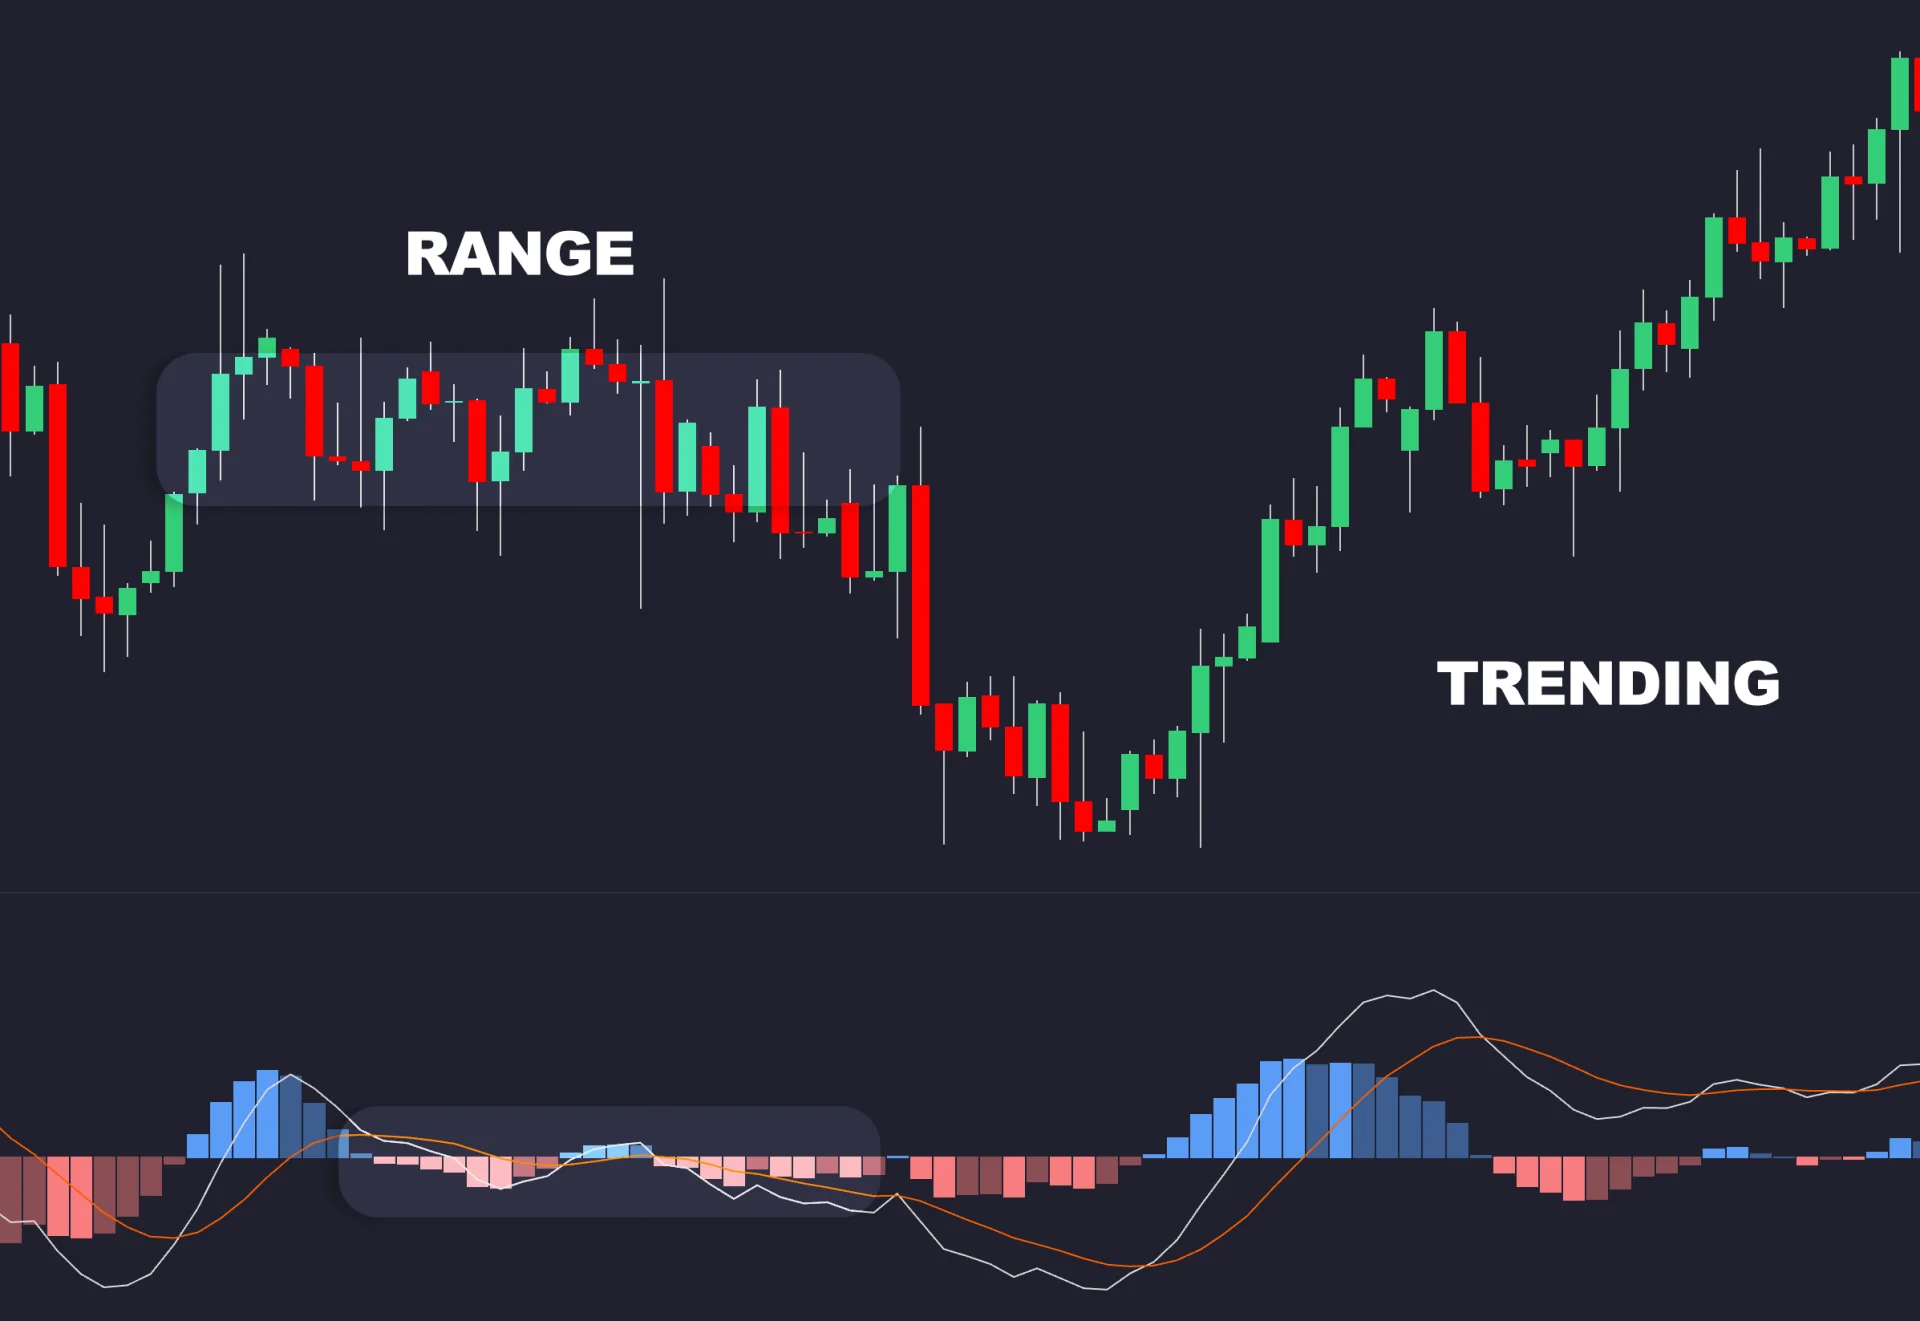
The Library's Moving Average Crossovers entry explains the mechanism as pure lag arithmetic. A shorter average tracks recent price more closely than a longer one, so when a trend turns, the fast average crosses the slow one only after enough new prices have accumulated. A crossover therefore confirms that a directional change is already underway, and the cost of the confirmation is distance from the actual turn. In a sustained trend that cost is paid once and the position rides. In a trading range the averages flatten and braid around each other, generating whipsaw after whipsaw, because every rotation between the range's ceiling and floor is enough to flip the fast average across the slow one and back.
The Trading Range entry describes the environment MACD struggles in. Price rotates between a ceiling that sells and a floor that buys with neither side able to force a lasting escape; participation fades in the middle and expands at the edges; and attempted escapes frequently fail, so the false breakout is a native feature of ranges rather than an anomaly. The entry's conclusion applies directly to MACD: classifying the regime correctly is often worth more than any individual signal, because the range playbook inverts the trend playbook. Fading the edges keeps working until the one breakout that ends the range, while trend entries taken inside the box, which is exactly what a signal cross is, tend to whipsaw.
MACD in Trending Markets
In a trend the MACD line tends to hold one side of zero for extended stretches, and the Library's account of how traders use it in that state is specific.
- Zero-line side as the regime. Above zero is treated as a bullish regime and below as bearish, often applied as a higher-timeframe filter that gates faster signals taken on lower timeframes.
- Signal crosses in the trend's direction. The workable version of the crossover trade takes only the crosses that agree with the zero-line side, so a bullish signal cross while MACD is above zero is read as a pullback ending, and the opposing cross is read as a warning rather than a short.
- Histogram for exits, not reversals. The first shrinking bar after a run of expansion flags fading thrust before either cross, which the Library describes as useful for tightening stops or scaling out rather than reversing outright.
- Divergence with confirmation. Price making a new extreme while the MACD line or histogram makes a lesser one is a regular divergence, generally traded only with further confirmation because the trend can extend long after momentum flattens.
None of this makes MACD predictive. The Library's phrasing is that a cross states momentum turned relative to its recent path, nothing more, and that most workable approaches take crosses only in the direction of a separately measured trend or at levels where a reaction was already expected.
MACD in Ranging Markets
Inside a range the same three signals degrade for the reason the crossover entry gives: the averages braid. Signal crosses fire on every rotation, zero-line crosses arrive as price is already at the opposite edge, and the histogram oscillates around zero without the sustained expansion that makes its inflections meaningful. The Library's Trading Range entry adds the second failure mode: the breakouts that a crossover appears to confirm are frequently false, so the cross that finally agrees with an escape is often the one that traps the position.
Three approaches are documented as ways of working with, rather than against, this behaviour.
- Stop trading crosses. The most common practical response is a regime gate: when the classifier says range, the crossover rules are switched off entirely and the range playbook of fading the edges, described in the Trading Range entry, takes over. This is what the Library means when it says most rules add a trend or regime filter on top of raw crosses.
- Trade divergence at the edges, carefully. A divergence between price at a range extreme and the MACD histogram is the one MACD reading that suits a range, because it points back into the box. The Divergence entry's caveat matters here: divergence is measured between confirmed swing points, and comparing a pivot to a mid-move wiggle manufactures divergences that were never there, which is one reason automated detectors disagree.
- Do not expect a setting to fix it. The MACD entry is direct about parameters: 12, 26 and 9 are conventional defaults inherited from daily charts, not optimised constants; shortening them speeds every reading up at the cost of more whipsaw; and no setting is reliably better across markets and regimes. Longer settings reduce the number of crosses in a range, but they also delay every trend entry, so the change trades one cost for another rather than removing either.
Classifying the Regime Before the Cross
Since the regime decides whether a crossover is tradeable, the useful work happens before the signal. The Library's Trend/range Classifiers entry lists the standard tools and, just as importantly, their limits.
- ADX. The ADX / DMI System, from Wilder's 1978 work, separates direction from strength. The DI lines carry direction and the ADX measures how persistently one side dominates, in downtrends as readily as uptrends. It is the default answer to whether a market is trending at all, at the known cost of lag from two rounds of smoothing: it confirms trends after they are underway and flags their end after the range has begun.
- Choppiness Index. The Choppiness Index compares the path travelled with the ground covered over a lookback, 14 by default, on a 0 to 100 scale. Heavy zigzagging inside a narrow span pushes it high; bars stacking in one direction pull it low.
- Higher-timeframe filter. The Higher-timeframe Trend Filter reduces a timeframe four to six steps above the trading timeframe to a directional state using price against a long EMA, that average's slope, Supertrend direction or an ADX reading, and permits only the crosses that agree. One implementation detail matters more than the indicator choice: a higher-timeframe value is only final when its bar closes, and a filter that reads the still-forming bar repaints, so backtests built on it overstate how clean the filter looked in real time.
The Classifiers entry's warning applies to all three: every input is computed from past bars, so labels lag; markets spend long stretches near the boundary where a noisy measure oscillates around its threshold; and regimes are only unambiguous in hindsight. Practical classifiers accept lateness in exchange for stability, using a different threshold for entering a state than for leaving it.
Trending and Ranging Conditions Compared
| MACD reading | In a trend | In a range |
|---|---|---|
| Zero-line side | Holds one side for long stretches; usable as the regime and as a higher-timeframe gate | Crosses zero repeatedly as price rotates; arrives as price reaches the opposite edge |
| Signal cross | Crosses in the trend's direction mark pullbacks ending; opposing crosses are warnings | Fires on every rotation; the braided averages produce whipsaw after whipsaw |
| Histogram | Expansion confirms thrust; the first shrinking bar is an early exit or stop-tightening cue | Oscillates around zero without sustained expansion, so inflections carry little information |
| Divergence | Warning to protect, traded only with structural confirmation | The one reading suited to ranges when anchored to confirmed swings at the edges |
| Best practice | Take crosses that agree with a separately measured trend | Switch crossover rules off and apply the range playbook |
Limitations
- Lag at every turn. Both the crossover and the regime classifiers are built from past bars. The trend is confirmed after it starts and the range is diagnosed after it begins, so some losses at each transition are structural rather than avoidable.
- Price scaling. Raw MACD levels cannot be compared across instruments or eras. Any rule that uses a numeric MACD threshold should be built on PPO or MACD-V instead.
- Repainting filters. Higher-timeframe gates and classifiers that read a live bar look better in backtests than they were in real time. Use closed-bar values only.
- No universal setting. Changing 12, 26 and 9 shifts the trade-off between whipsaw and lag; it does not eliminate either.
Where Quant Charts Fits
Quant Charts, the LuxAlgo charting and AI platform, is where the regime question can be tested rather than argued. It does not place orders.
- Indicators. The Library's standard MACD build and the LuxAlgo Adaptive MACD are listed on the MACD entry and open on a chart in one click. Adaptive MACD measures how directional price has been with a rolling R-squared coefficient and uses that reading to reshape the filter, staying close to the classic calculation when the reading is high and shifting toward short-cycle detection when it is low, so consolidation stops printing false momentum. ADX / DMI and the Choppiness Index are available from the same indicators menu for an explicit regime gate.
- Quant. Quant, our coding agent, writes Pine Script from a plain-language description. Describe a rule such as buying a MACD signal cross only when MACD is above zero and the 14-period ADX is above a chosen level, with the mirror rule for shorts, inspect the Code tab, and click Run. The Backtest Summary reports net profit, trade count, win rate, max drawdown and profit factor, and commission and slippage are set in the strategy Properties so the frequent small losers of a range are costed. Then remove the ADX condition and rerun: the difference between the two summaries is the measured cost of trading crosses inside ranges on that instrument and timeframe, which is the number this topic usually invents.
- Data. Quant Charts data covers Cboe EDGX US equities, including ETFs, and crypto on every plan; paid plans add forex, commodities and CME futures.
- Journal. On every plan, the Journal groups fills into round trips and breaks results down by symbol, side, day and hold time, so live crossover trades can be reviewed against the regime they were taken in.
Conclusion
MACD crossovers do not work in trends and fail in ranges because of anything mysterious. They are differences of lagging averages, and lagging averages separate cleanly when price travels and braid when it rotates. The practical consequence, documented across the Library's MACD, crossover, trading range and classifier entries, is that the regime has to be measured first and the crossover rules applied only where they belong: crosses in the trend's direction with the zero-line side or a higher-timeframe filter as the gate, and the crossover switched off in favour of edge-fading or anchored divergence when the classifier says range. Whatever the setting, the trade-off between whipsaw and lag remains, and the honest way to size it is a backtest split by regime rather than a borrowed percentage.
FAQs
What is a MACD crossover?
Either the MACD line crossing its 9-period signal line, called a signal cross, or the MACD line crossing zero, which means the 12-period EMA has crossed the 26-period EMA. The signal cross is the faster of the two and the zero-line cross is a trend statement.
Why do MACD crossovers fail in ranging markets?
Because MACD is a difference of moving averages, and in a range the averages flatten and braid around each other. Every rotation between the range's edges flips the fast average across the slow one, so signal crosses fire constantly and most of them reverse.
What are the best MACD settings for trending or ranging markets?
The Library states that 12, 26 and 9 are conventional defaults, not optimised constants, and that no setting is reliably better across markets and regimes. Longer settings reduce crosses in a range but delay trend entries; the trade-off moves, it does not disappear.
How do I tell whether the market is trending before trading a cross?
Use a trend/range classifier such as ADX above a chosen level, the Choppiness Index below a chosen level, or a higher-timeframe trend filter based on closed bars. All of them lag and all of them are noisy near the boundary, so practical rules use different thresholds for entering and leaving a state.
Is the MACD histogram a better signal than the crossover?
It is earlier, not better. The histogram is the spread between the MACD line and its signal, so its first shrinking bar shows momentum fading before a cross prints. In trends that is an exit or stop-tightening cue; in ranges it oscillates around zero and carries little information.
Can Quant Charts test MACD crossovers separately in trends and ranges?
Yes. Quant writes a Pine Script strategy from a description that includes a regime condition such as an ADX threshold, and the Backtest Summary reports net profit, trade count, win rate, max drawdown and profit factor. Running the rule with and without the regime gate measures the cost of trading crosses in ranges. Quant Charts does not place orders.
References
LuxAlgo Resources
- MACD
- Moving Average Crossovers
- Trading Range
- False Breakout
- Higher-timeframe Trend Filter
- Trend/range Classifiers
- ADX / DMI System
- Choppiness Index
- Regular Bullish/bearish Divergence
- PPO
- MACD-V
- Adaptive MACD indicator
- Quant Charts docs: Quant strategies
External Resources
- Gerald Appel, Technical Analysis: Power Tools for Active Investors (2005), the original account of MACD, and J. Welles Wilder, New Concepts in Technical Trading Systems (1978), the source of ADX and DMI. Print works; no primary online text is linked.
- Alex Spiroglou, MACD-V: Volatility Normalised Momentum (2022). The paper is hosted on SSRN, which was not reachable for verification, so it is cited without a link.
This article is for educational purposes only and is not financial advice. Indicator signals describe past price behaviour and do not guarantee future results.
Read next