Concept
PPO
PPO, also known as percentage price oscillator, 3-10 oscillator, is a Momentum & Oscillators concept. The Library holds 1 implementation, a working definition you can pull into Quant.
Top PPO indicator
The top custom implementation, built on the original standard PPO formula.
1 total
From studying PPO to trading it: take the implementation below into Quant and backtest it instantly.
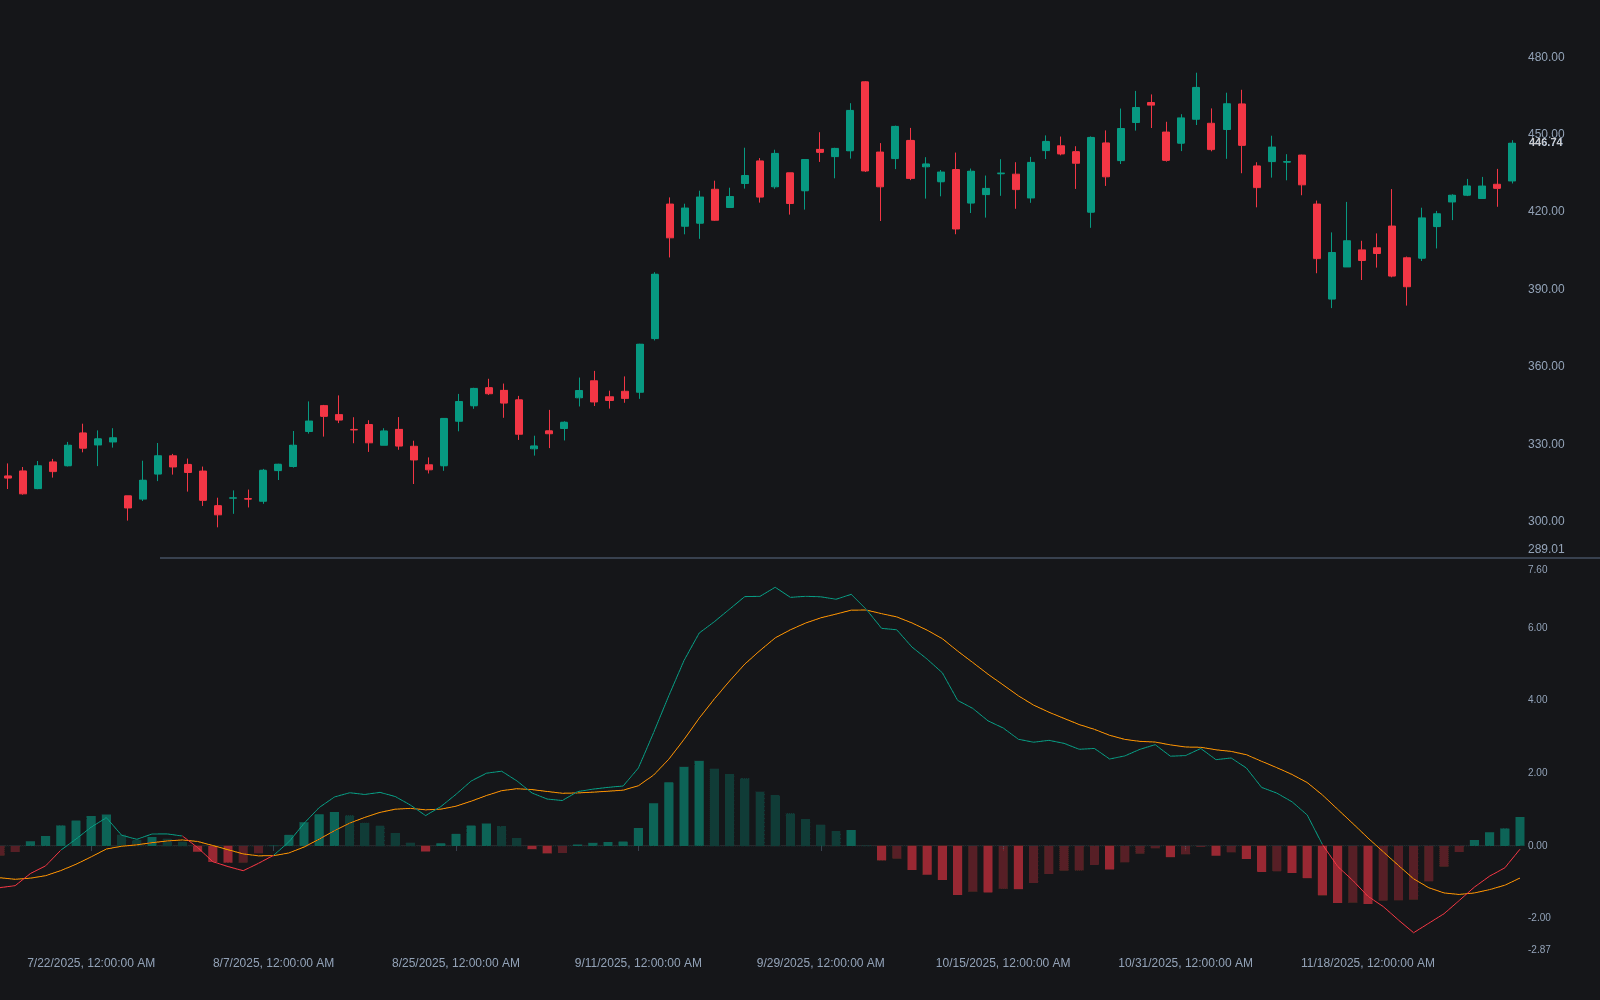
What is the PPO?
The PPO (percentage price oscillator) is a momentum oscillator built exactly like MACD but expressed in percentage terms. It subtracts a slow EMA of price from a fast one (12 and 26 periods are the usual defaults), then divides the difference by the slow EMA and multiplies by 100. A reading of +2 therefore means the fast average sits 2% above the slow one, whether the instrument trades at $5 or $50,000. A signal line, normally a 9-period EMA of the PPO, and a histogram of the gap between the two complete the standard display.
The normalization is the entire point. Raw MACD values are in price units, so they grow as price grows and cannot be compared across symbols or across years of history. PPO readings can: the same percentage means the same relative stretch everywhere, which suits scanning a watchlist, ranking momentum across markets, or reading the long history of an asset that has re-priced by multiples. In every other respect it behaves like its parent, from Gerald Appel's original crossover logic to the way traders read the histogram.
How to calculate the PPO
The PPO is computed from closing prices in a few steps, the same recipe as MACD with one extra division.
- 1Compute a fast and a slow EMA of the close. The defaults inherited from MACD are 12 and 26 periods.
- 2Subtract the slow EMA from the fast EMA, divide the result by the slow EMA, and multiply by 100. This percentage is the PPO line.
- 3Smooth the PPO line with a 9-period EMA to form the signal line.
- 4Plot PPO minus signal as a histogram: growing bars mean the spread between the averages is widening; shrinking bars mean it is narrowing.
How it's calculated
Measures the distance between a fast and a slow EMA as a percentage of the slow EMA, making momentum readings comparable across symbols and price levels.
Same construction as MACD but divided by the slow EMA, so readings are in percent and comparable across instruments and time.
The 3-10 oscillator (Linda Raschke) is the fast variant with lengths 3 and 10, classically a plain difference of simple moving averages with a 16-period signal rather than a percentage.
Defaults 12, 26 and 9 mirror MACD.
How traders use it
- As a trend-bias filter: PPO above zero means the fast EMA is above the slow one. Many traders only take longs while the oscillator holds above zero and shorts below it, a standard centerline regime read.
- For crossover timing: PPO crossing its signal line is the early, noisier trigger, while a zero-line cross is the slower confirmation that the underlying averages themselves have crossed. Zero-line crosses land on the same bars as MACD's on identical settings.
- For divergence: price printing a new extreme while the PPO prints a weaker one flags fading momentum (regular divergence). The percentage scale keeps long-horizon comparisons honest on assets whose price has multiplied, where raw-unit oscillators overweight the recent past.
- For cross-market screening: because values are percentages, PPO readings can be ranked across a whole universe of symbols, a common way to build momentum screens that raw MACD values cannot support.
PPO vs neighboring oscillators
MACD: Identical construction, different units. MACD leaves the two-EMA spread in price terms, so its values scale with the instrument's price; PPO divides by the slow EMA to state the spread as a percentage. On a single chart they look nearly the same and cross zero on the same bars; PPO earns its keep across symbols and long histories.
APO: The absolute price oscillator is the two-EMA spread left in raw price units, essentially the MACD line under another name. PPO is its normalized twin. APO suits single-instrument work where point values matter; PPO suits anything comparative.
ROC: ROC compares price with its own value N bars ago and states the change as a percentage, so it is also unit-free, but it rests on a single raw comparison and is correspondingly jumpy. PPO compares two smoothed averages, trading some responsiveness for a steadier line.
Concept family
Momentum & Oscillators
91 concepts mapped · 91 in the Library
PPO FAQ
Turn PPO into a trading strategy.
Take the implementation from this page into Quant, then build on it, backtest it on real data, and keep refining it in conversation.