Relative Strength vs Momentum Indicators: Pros and Cons
RSI is a momentum indicator. Comparative relative strength is a different measurement: it compares one asset with another asset or a benchmark. Understanding that distinction makes the pros and cons much clearer. RSI, MACD and rate of change describe aspects of an asset’s own price movement; a relative-performance comparison asks which asset is leading or lagging.
You can use both types of analysis in native LuxAlgo charts: inspect the price context, add standard RSI and MACD from the Indicators picker, and test explicit trading rules with Quant, our coding agent. Agreement between two indicators is evidence to investigate, not proof of a profitable trade.
Quick Comparison: Three Different Questions
| Tool | Question it answers | Main advantage | Main limitation |
|---|---|---|---|
| Comparative relative strength | How is this asset performing versus a benchmark? | Highlights relative leadership or weakness | Outperformance can still mean losing money |
| Relative Strength Index (RSI) | How do smoothed recent gains compare with losses? | Bounded 0–100 scale helps interpret momentum | Extreme readings can persist in strong trends |
| MACD | How far apart are two exponential moving averages? | Shows changing trend momentum and signal-line relationships | Can whipsaw in ranges; values depend on price scale |
| Rate of change (ROC) | What percentage has price changed over a chosen period? | Direct, interpretable percentage movement | Sensitive to lookback and the observation dropping out of the window |
Relative Strength Is Not the Same as RSI
Fidelity’s relative strength comparison guide describes comparing two prices by division. An upward-sloping asset/benchmark ratio indicates relative outperformance; a falling ratio indicates underperformance. The starting value depends on the units and prices used, so its direction or rebased change is more informative than an isolated number.
Example: an asset moves from $100 to $110 while its benchmark moves from $200 to $210. Their price ratio rises from 0.50 to about 0.5238. The asset gained 10%, versus 5% for the benchmark: a 5-percentage-point return advantage. The ratio itself rose about 4.76%, which is a different calculation.
An asset falling 5% while its benchmark falls 10% also outperforms. That does not turn the asset’s loss into a gain. Use matching dates, trading sessions, currency conventions and consistently adjusted data. A price-only comparison can differ from a total-return comparison that includes distributions.
RSI does not perform this benchmark comparison. Its “relative strength” term refers to average upward and downward price changes within the same series. Neither reading measures business value or guarantees future leadership.
How RSI and Other Momentum Indicators Work
RSI: Smoothed Gains Versus Losses
Fidelity’s RSI guide identifies RSI as a momentum oscillator developed by J. Welles Wilder. Its formula is RSI = 100 − 100 / (1 + RS), where RS is the smoothed average gain divided by the smoothed average loss, using positive magnitudes for losses. A common setting is 14 bars; Wilder-style smoothing and initialization matter when reproducing values.
If the smoothed average gain is 1.5 and the smoothed average loss is 0.5, RS is 3 and RSI is 75. That is an oscillator value, not a 75% probability of a reversal. Zero-loss and completely flat sequences need the implementation’s special-case handling rather than ordinary division by zero.
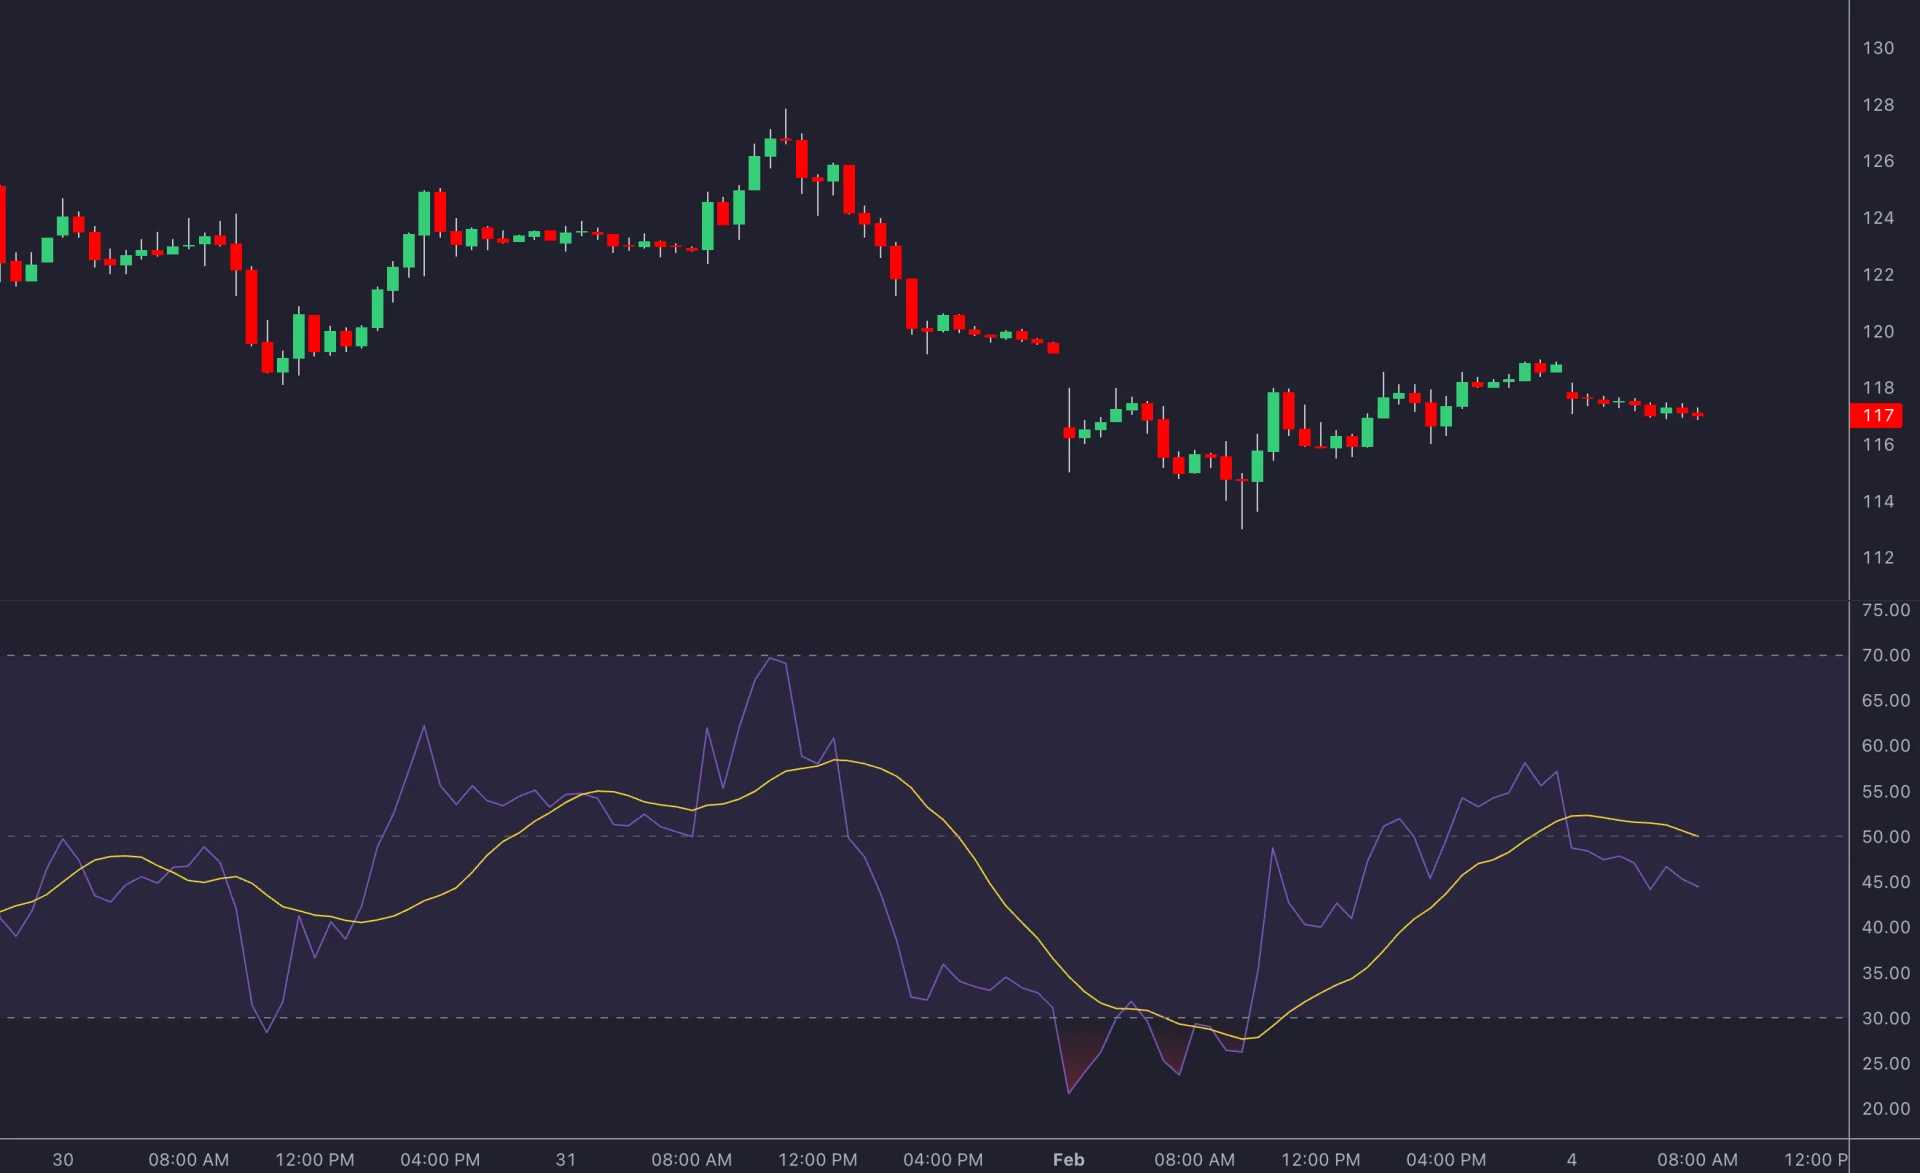
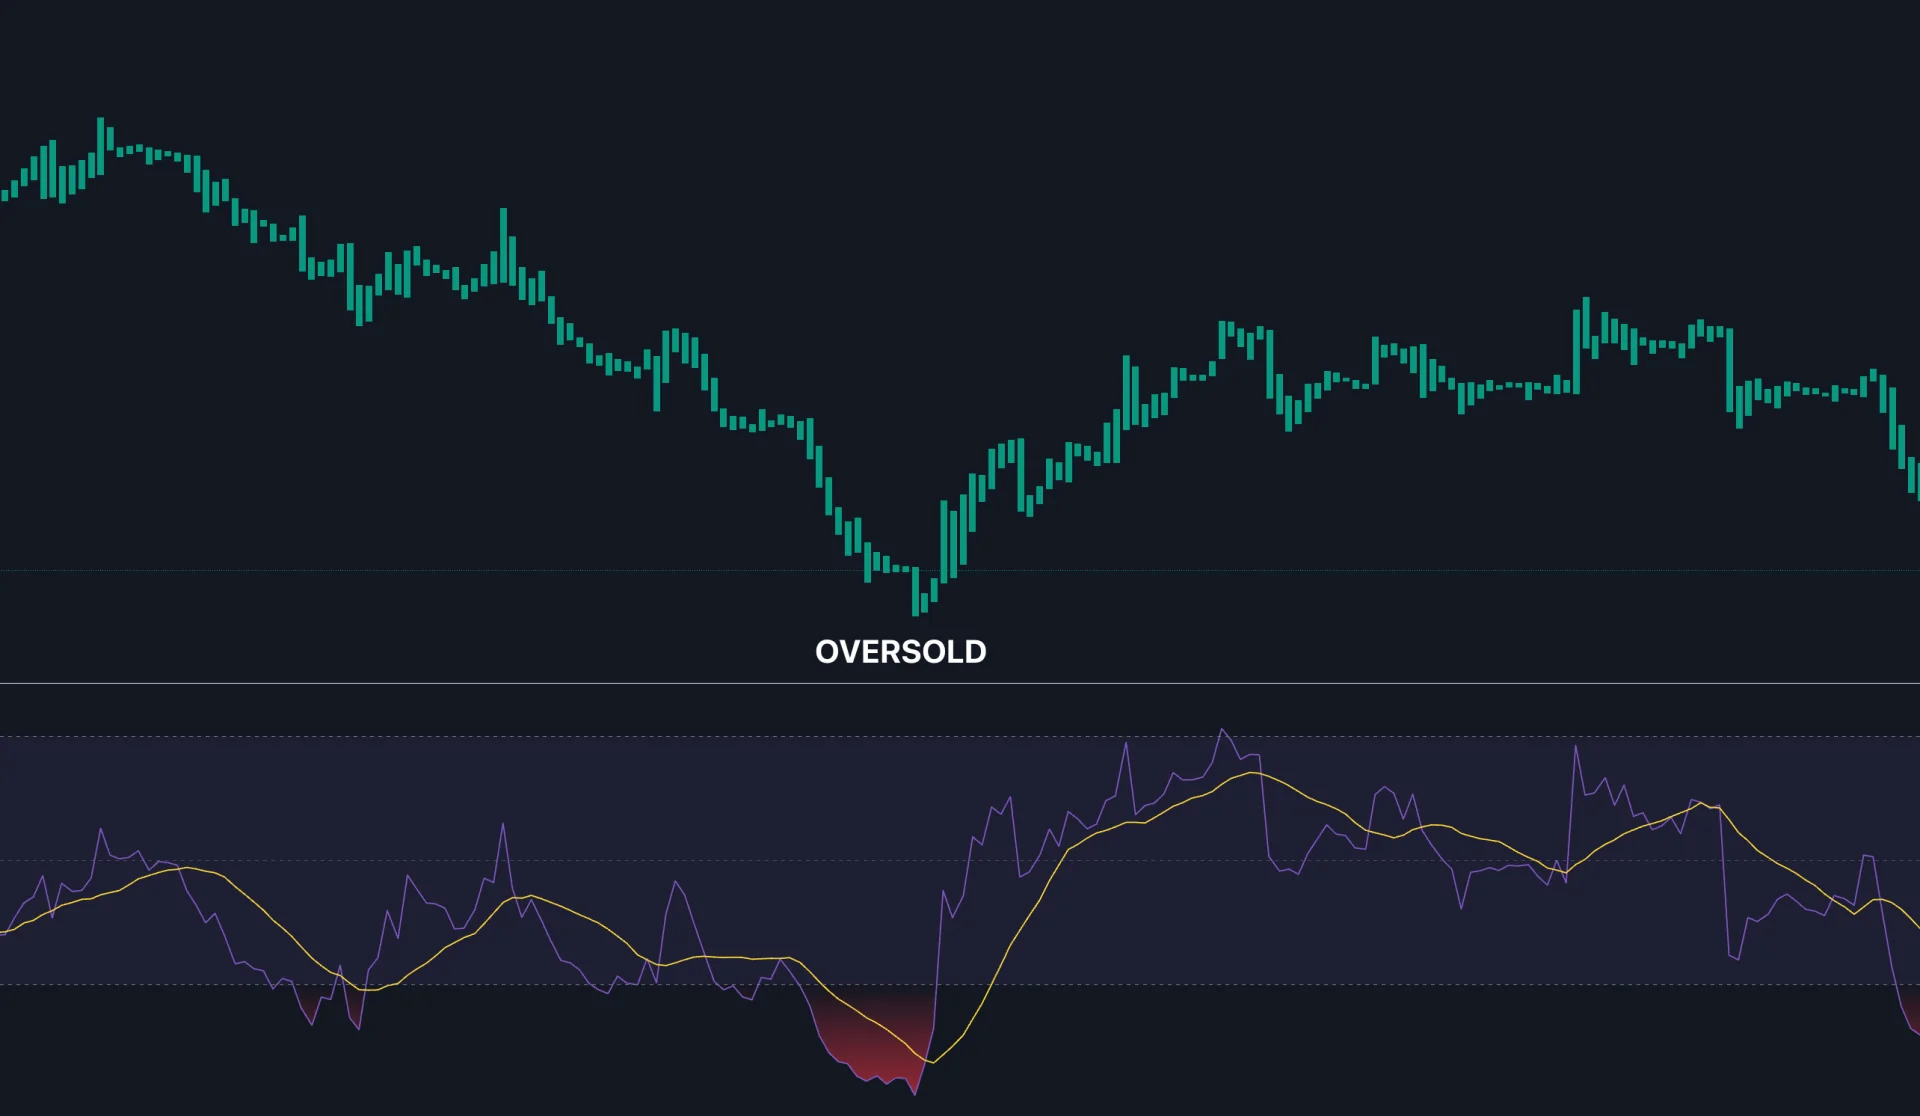
Traditional reference levels are 70 and 30. Above 70 is commonly called overbought; below 30 is oversold. Neither automatically means sell or buy. Strong uptrends can hold elevated RSI readings, and strong downtrends can hold depressed readings. RSI can also help describe a trend through its typical range and its position relative to 50.
MACD: Two Moving Averages and a Signal Line
The conventional MACD line is the 12-bar EMA minus the 26-bar EMA. Its signal line is commonly a 9-bar EMA of MACD, and the histogram is MACD minus that signal line. These are configurable conventions, not optimal settings for every market. Fidelity’s MACD guide explains the calculation and the risk of repeated crossovers in trading ranges.
A MACD line above zero means the fast EMA is above the slow EMA. A positive histogram means MACD is above its signal line. These are different statements: MACD can cross above its signal line while both remain below zero. A shrinking negative histogram can indicate weakening downward momentum while price is still falling.
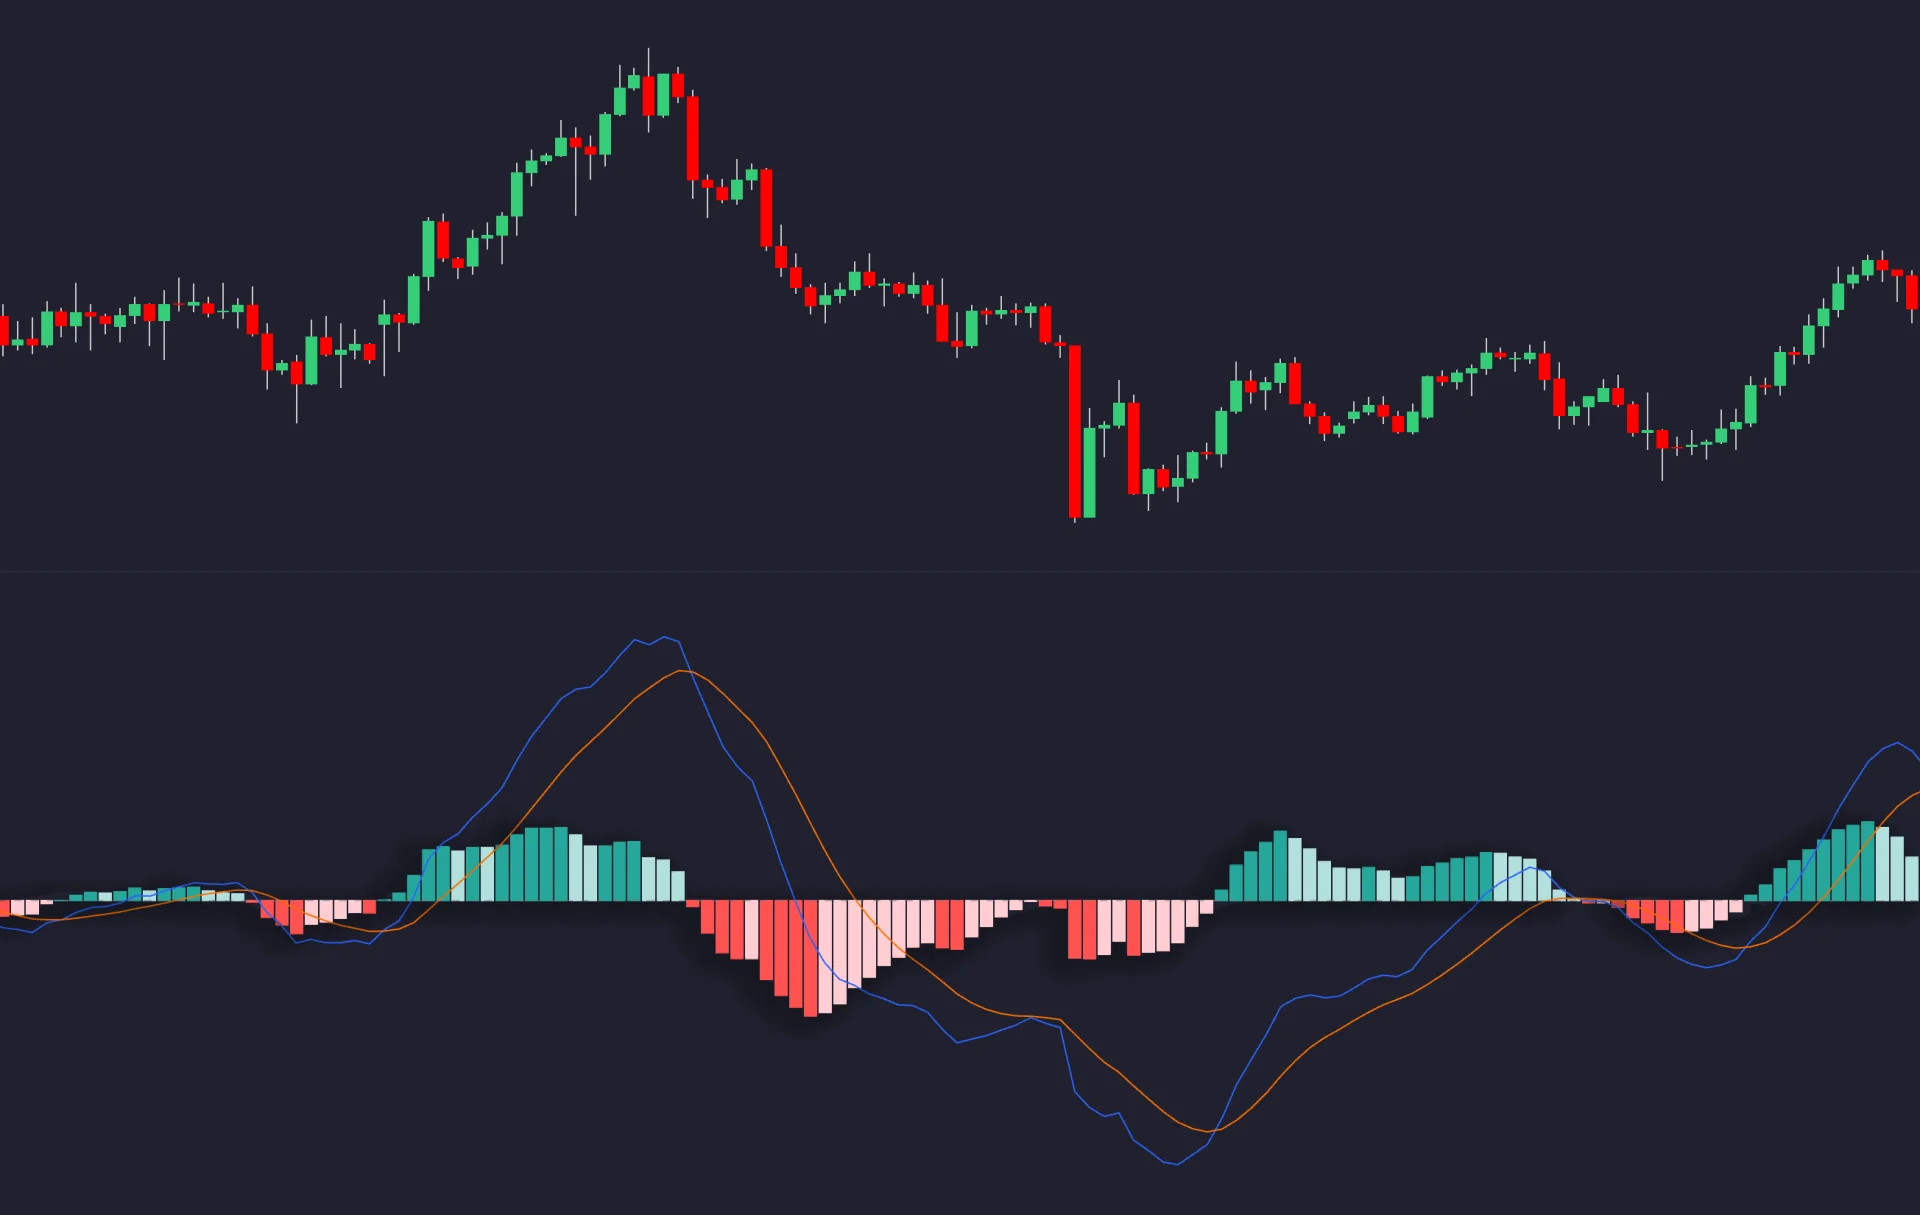
MACD is unbounded and expressed in price units. Its level cannot be compared directly across a $10 stock and a $1,000 stock as a universal strength score. Other momentum studies have different scales: RSI and stochastic oscillators are bounded, while percentage ROC expresses change relative to an earlier price. “Momentum indicator” does not imply a particular scale or signal speed.
Worked Calculations
| Measurement | Illustrative inputs | Result | What it does not establish |
|---|---|---|---|
| RSI | Smoothed gain 1.5; smoothed loss 0.5 | 100 − 100/(1 + 3) = 75 | A reversal probability |
| MACD line | Fast EMA 102; slow EMA 100 | 2 price units | A percentage return |
| MACD histogram | MACD 2; signal line 1.5 | 0.5 price units | That the trade is profitable |
| ROC | Current price 110; price n bars ago 100 | 100 × (110/100 − 1) = 10% | A future return forecast |
Pros and Cons in Different Market Conditions
There is no universal rule that RSI is faster and MACD slower, or that momentum tools only work in rising markets. Responsiveness depends on the exact formula, settings, timeframe and trigger. A short calculation can react quickly but switch direction often; additional smoothing can reduce fluctuations while delaying a response.
| Approach | Useful role | Tradeoff to test |
|---|---|---|
| RSI in a range | Describe recent upward/downward pressure near a price boundary | The range can break; fading every extreme can accumulate losses |
| RSI in a trend | Track persistent momentum and pullbacks | Selling solely because RSI exceeds 70 can oppose a continuing uptrend |
| MACD in a trend | Describe EMA separation and changes in momentum | Crossovers can arrive after a substantial move |
| MACD in a range | Expose repeated changes around a relatively flat trend | Frequent entries can lose to whipsaws and costs |
| Relative-performance comparison | Select leaders or laggards within a defined universe | Benchmark choice and changing leadership affect conclusions |
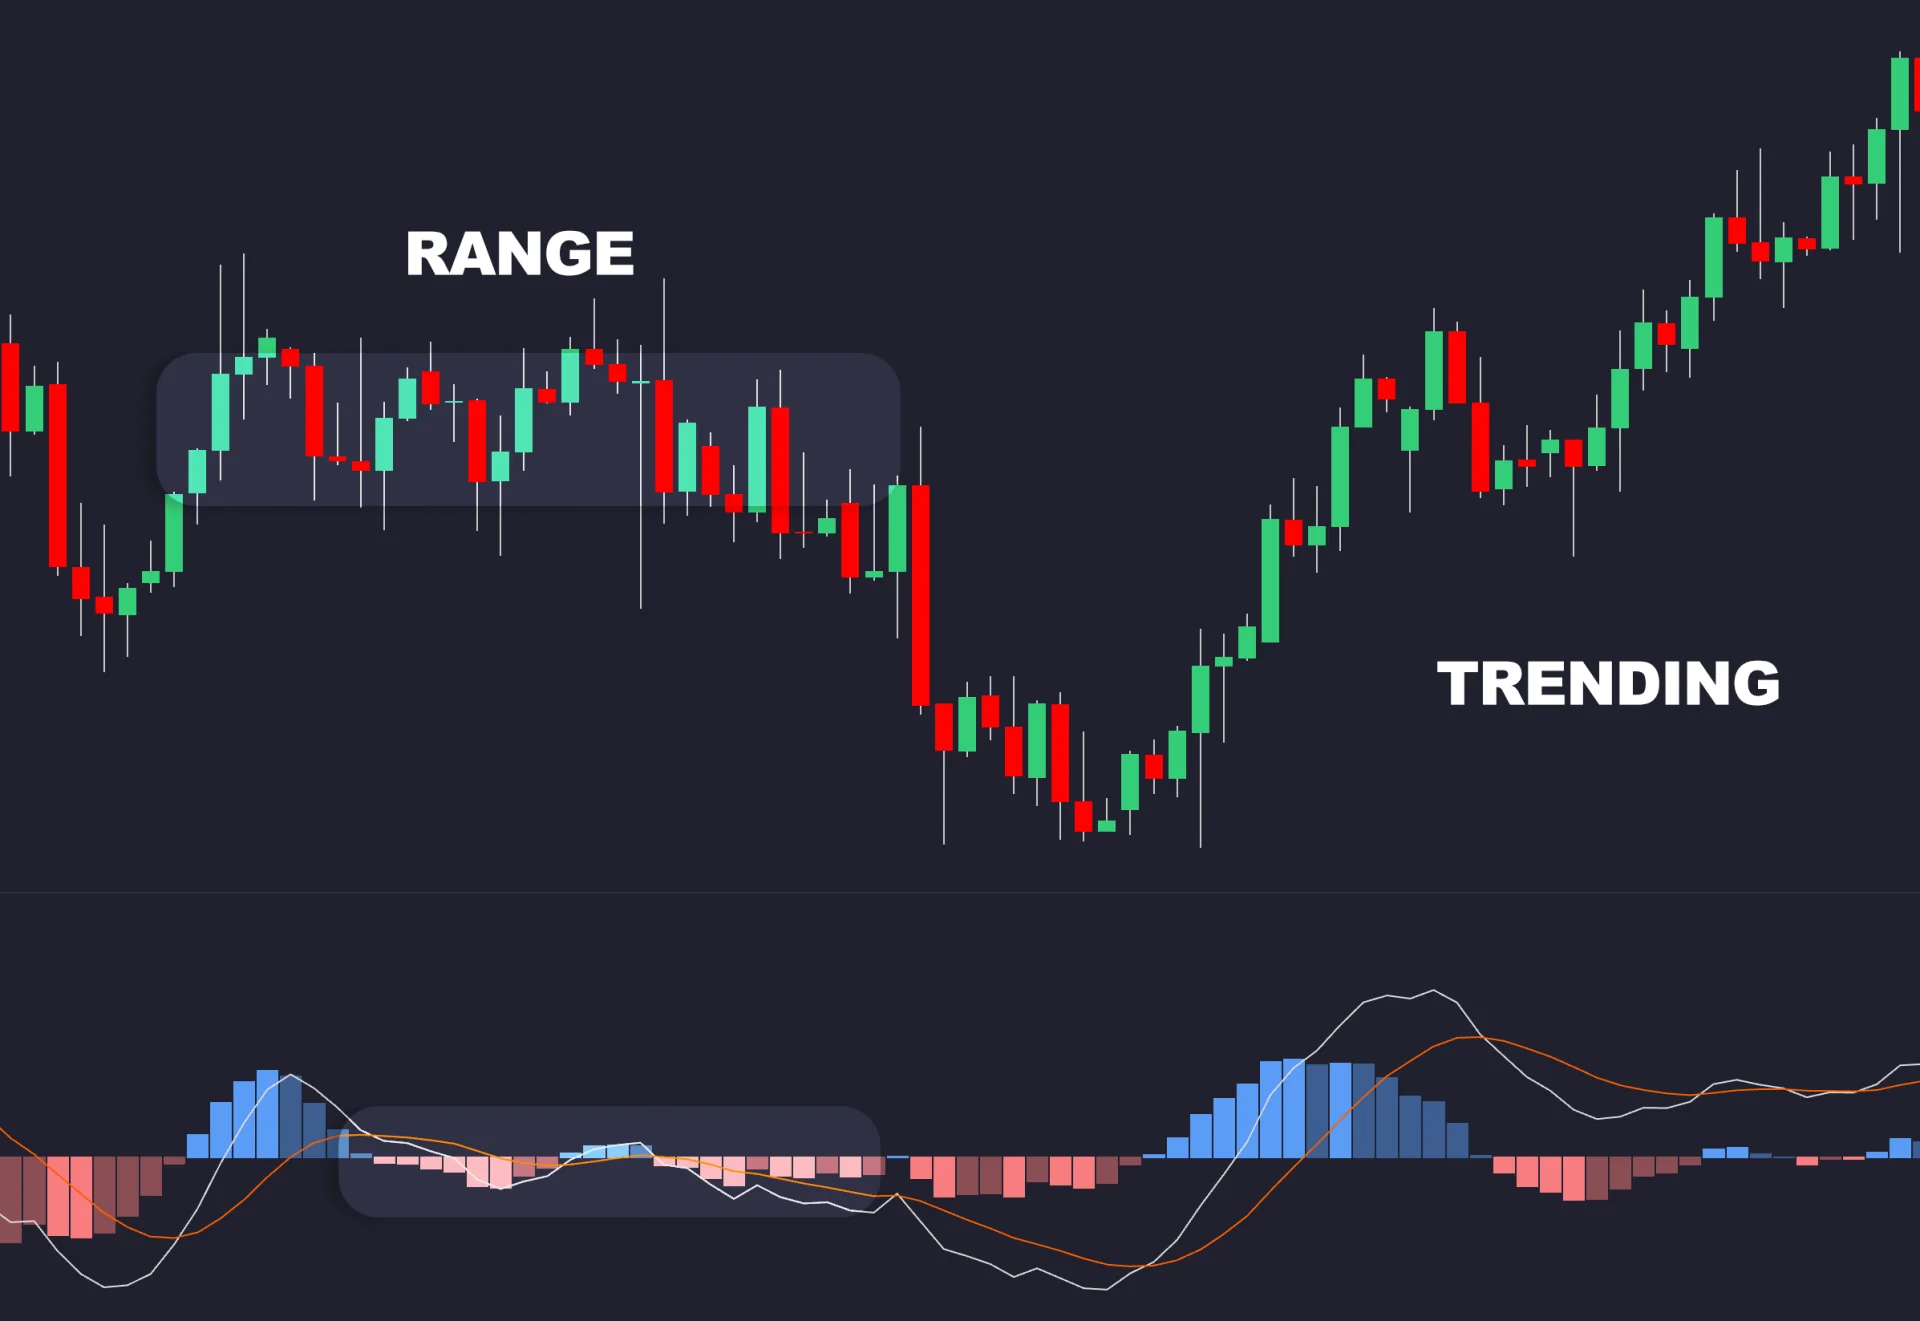
Low liquidity, gaps and abrupt repricing can make execution difficult even when an indicator is calculated correctly. That is different from declaring the indicator inaccurate. A signal can accurately describe past prices and still be a poor entry. Evaluate both rising and falling markets, including periods when the strategy is inactive.
Combining Indicators Without Double-Counting Evidence
RSI and MACD use overlapping price information, so agreement is not independent confirmation. Adding a filter may reduce trade count without improving returns after costs. Compare an RSI-only rule, a MACD-only rule and a combined rule on the same data, with the same execution assumptions.
For example, RSI below 30 plus bullish divergence on MACD is a setup to define and test. Specify which price lows are compared, which oscillator values correspond to them and when those lows become knowable. A pivot identified using later bars must not trigger a simulated entry before those bars exist. A divergence can persist while price continues lower.
An Explicit Example to Test
- Choose a symbol, ordinary candle chart, timeframe and fixed test dates. Use RSI length 14 and MACD lengths 12/26/9 as an illustrative baseline.
- On a completed bar, require RSI to cross from at or below 30 to above 30, while MACD is above its signal line. This is a state condition for MACD, not a requirement that both cross on the same bar.
- Model entry at the next available bar open. Define order size, stop distance, profit target, maximum holding period and treatment of gaps before running the test.
- Compare this combined rule with the RSI condition alone. Include commission and slippage, inspect individual trades and evaluate a later period that was not used to select parameters.
These rules are an educational experiment, not a recommended trade. An oversold recovery setup differs from buying persistent strength in an uptrend; do not combine incompatible entry ideas merely because both use RSI.
Adjust Settings Deliberately
Widening RSI thresholds to 80/20 changes how often extremes occur; it does not automatically solve high volatility. Longer MACD periods generally add smoothing, while shorter periods generally respond more quickly. Test a small, predeclared set of alternatives instead of repeatedly tuning to whichever historical outcome looks best. Use completed higher-timeframe bars if a higher-timeframe filter is part of the rule.
Analyze and Test in Native LuxAlgo Charts
Open your LuxAlgo workspace, select the active chart cell, then choose Indicators → Basic for RSI or MACD. Configure lengths and sources from the legend settings. The Data window helps inspect exact values, and indicator templates save a repeatable setup. The current native indicator documentation covers Basic studies, the built-in LuxAlgo Library, favorites and templates.
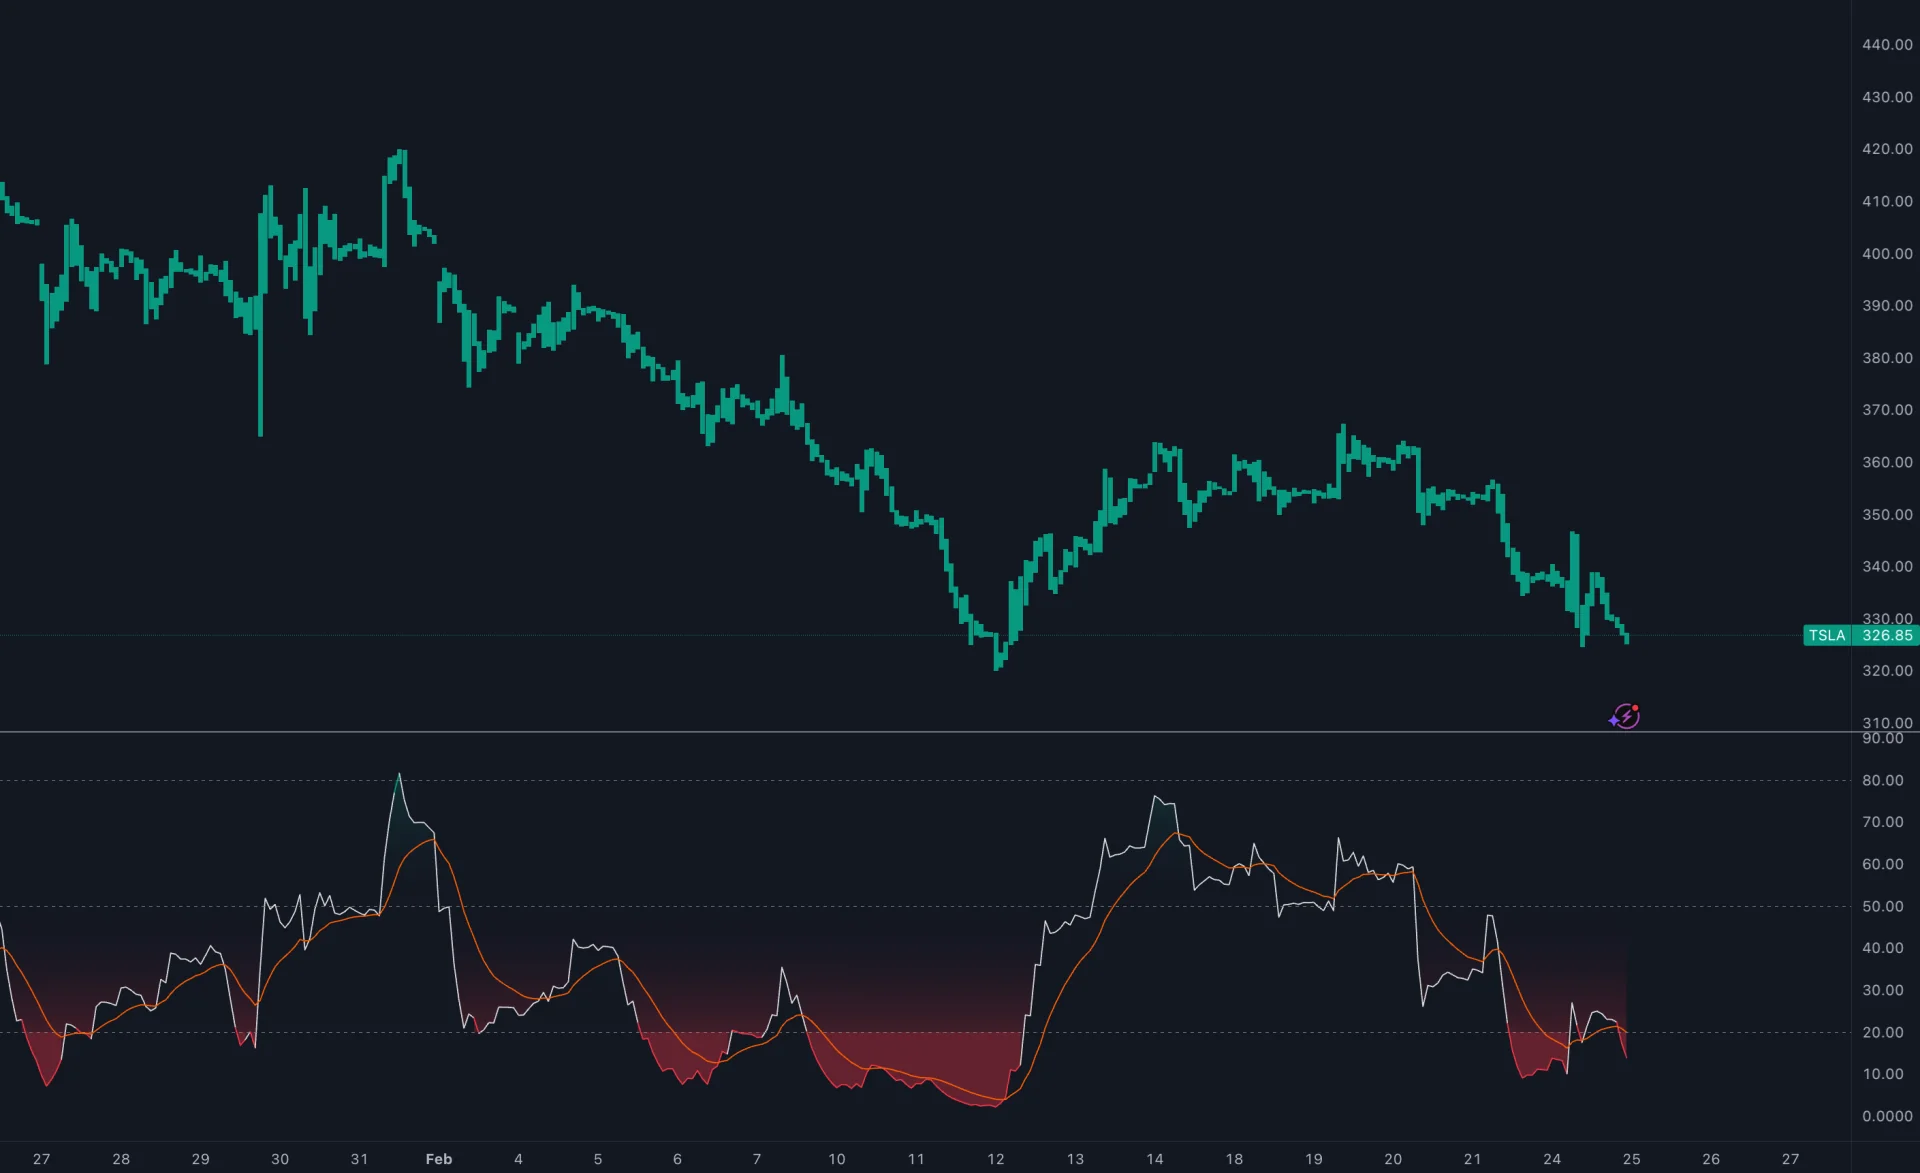
The Library also contains specialized studies. Treat variations such as Ultimate RSI or adaptive MACD as different implementations whose formulas and controls need inspection. “Adaptive” or “Ultimate” is not evidence of higher predictive accuracy. The historical Ultimate RSI illustration below shows a modified oscillator and smoothing line, not a combined RSI-and-MACD chart.
To turn a precise idea into a strategy, describe it to Quant, our coding agent. Open Code, inspect the generated entry, exit and risk logic, then run manually. Check that the implementation uses the intended sources, completed-bar timing and costs. Making strategies with Quant explains generation, review and execution; the strategy viewer covers the resulting backtest.
Risk and Strategy Review
A stop order does not guarantee execution at its trigger price. As a simple sizing example, an assumed $50 entry and $48 stop imply $2 per share before costs. With a $100 modeled risk budget and $10 estimated total costs, 45 shares use that budget: 45 × $2 + $10 = $100. If the stop is executed at $47 after a price gap, the modeled loss becomes $145 with those same costs.
Review net results, drawdowns, trade count and sensitivity to costs rather than maximizing one headline statistic. Keep the test universe and benchmark consistent, and record changes before retesting. A visually convincing chart or an improved historical result does not establish that the strategy will remain effective.
FAQs
Is relative strength the same as momentum?
Comparative relative strength measures an asset against another asset or benchmark. Momentum describes movement in a price series. RSI is a momentum oscillator despite the words relative strength in its name.
Is RSI a momentum indicator?
Yes. RSI compares smoothed gains and losses within one price series on a 0–100 scale. It does not compare the asset with a market benchmark.
Is RSI faster or more reliable than MACD?
There is no universal ranking. Formula, settings, timeframe, signal definition and market conditions determine responsiveness and usefulness. Compare explicit rules after costs.
Does an RSI reading above 70 mean I should sell?
No. It describes elevated recent momentum under a traditional convention. The reading can persist during a strong uptrend and is not a complete exit rule.
Can relative strength rise while price falls?
Yes. An asset that falls less than its benchmark can outperform while still losing value. Relative outperformance is different from a positive absolute return.
Can I test RSI and MACD rules in LuxAlgo?
Yes. Add the standard studies in native charts, describe explicit entry and exit rules to Quant, inspect the generated code and run manually. Include realistic costs and verify individual trades and later-period results.
Read next