Concept
Relative Strength Comparative
Relative Strength Comparative, also known as RS line vs benchmark, Mansfield RS, IBD-style rank, leadership analysis, is a Breadth, Sentiment & External Data concept. The Library holds 3 implementations, each one a working definition you can pull into Quant.
Top Relative Strength Comparative indicators
The top custom implementations, built on the original standard Relative Strength Comparative formula.
3 total
Want to trade Relative Strength Comparative? Any of the 3 implementations below is one prompt away from a backtested strategy in Quant.
What is Relative Strength Comparative?
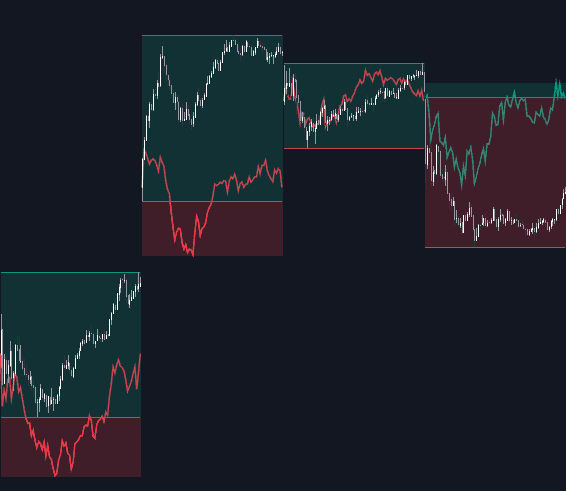
Relative strength comparative measures how an instrument performs against a benchmark or another instrument, most simply as the RS line: the stock's price divided by an index, plotted bar by bar. A rising line means outperformance in every kind of tape, including down markets where the stock merely falls less. It is unrelated to RSI, which compares a market to its own past. Standard variants include Mansfield relative strength, popularized by Stan Weinstein, which normalizes the RS line by its own 52-week average so it oscillates around zero, and rank-style ratings, which percentile-rank trailing performance across a whole universe, typically over twelve months with extra weight on recent months.
Leadership analysis is the point. Cross-sectional momentum, the tendency of recent relative winners to keep outperforming over intermediate horizons, is one of the most extensively documented effects in the academic literature, though like any effect it goes through long droughts. Practically, RS comparative directs attention: it identifies which sectors lead the market and which names lead their sector, and it flags trouble when price makes a new high that the RS line refuses to confirm, a warning that the move is losing relative sponsorship.
How to calculate Relative Strength Comparative
The base calculation is a single division; the variants are normalizations layered on top.
- 1Divide the instrument's price by the benchmark's price on each bar (stock over S&P 500, altcoin over BTC, sector over market) and plot the result as a line: this is the RS line, a ratio chart.
- 2Read slope and structure, not level: the absolute value depends on the two price scales and means nothing by itself. Apply the usual tools (moving averages, trendlines, prior highs and lows) to the line itself.
- 3For Mansfield RS, divide the RS line by its own 52-week simple moving average, subtract one, and scale the result; readings above zero mean the stock is outperforming its own relative-strength trend.
- 4For rank-style RS, compute trailing returns for every name in a universe and percentile-rank them (1 to 99), re-ranking periodically to track rotation.
How traders use it
- As a leadership screen inside top-down analysis: first find the sectors with rising RS against the market, then the names with rising RS against the sector, concentrating attention where sponsorship already is.
- As confirmation and divergence: a price breakout accompanied by an RS line breaking to new highs carries more conviction, and growth-stock methodologies explicitly look for the RS line reaching new highs ahead of price.
- As rotation timing: paired with a sector rotation model or relative rotation graphs, RS trends show leadership passing from one group to another before it is obvious in absolute prices.
- As the basis of pairs work: a persistent RS trend or a stretched RS extreme is the raw material for long/short spreads, where the ratio itself becomes the traded chart.
Relative Strength Comparative vs related concepts
RSI: The name collision is the classic trap: RSI is an oscillator comparing a market's recent gains to its recent losses, an internal measure. Relative strength comparative always involves a second instrument as the yardstick.
Ratio Charts: The RS line is a ratio chart, so the terms overlap. Ratio charts is the general charting technique for any two instruments; RS comparative is the leadership methodology built on it, with conventions like benchmark choice and Mansfield normalization.
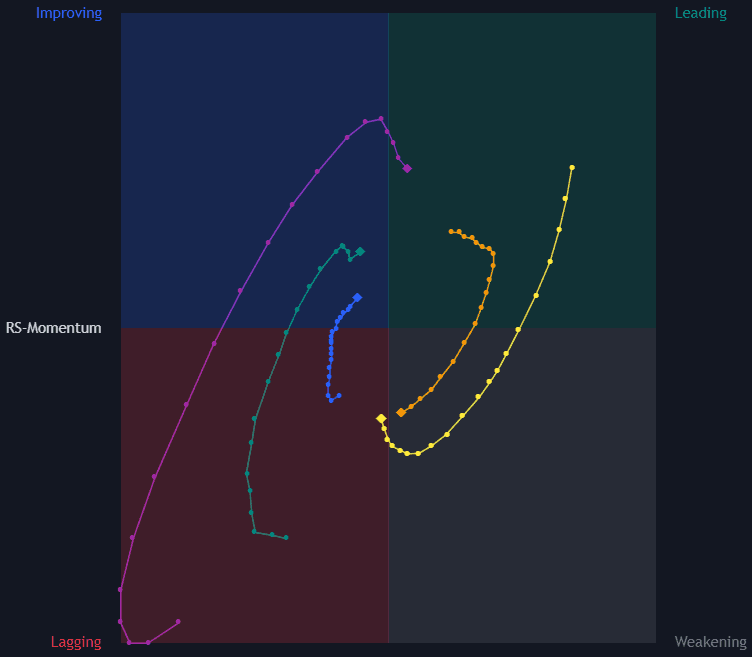
Relative Rotation Graphs: RRGs plot many instruments' relative strength and its momentum on one rotating quadrant display. An RS line studies one relationship in depth; an RRG surveys a whole universe's rotation at a glance.
Concept family
Breadth, Sentiment & External Data
63 concepts mapped · 63 in the Library
Relative Strength Comparative FAQ
Turn Relative Strength Comparative into a trading strategy.
Take any implementation from this page into Quant, then build on it, backtest it on real data, and keep refining it in conversation.