ThinkScript Coding: Automate Your Thinkorswim Edge
thinkScript is the scripting language built into Charles Schwab's thinkorswim platform, and it automates three things well: custom studies that plot and colour whatever you can define, alerts that fire when a condition is true, and strategies that simulate entries and exits on historical bars so you can read a strategy report. What it does not do is place live orders: a thinkScript strategy is a backtest drawn on the chart, and the only order automation thinkorswim offers is a working order tied to a condition through the platform's order rules. Knowing that boundary is the difference between a useful thinkScript workflow and a frustrating one. This guide covers what the language can and cannot automate, the editor and IDE workflow, four building blocks with code that compiles as written, the alert types and how they differ, the testing habits that catch the classic mistakes, and how the same rules translate to Quant Charts, where Quant, our coding agent, writes and backtests them from a sentence.
Key points:
- Studies, alerts and strategies are the automation. thinkScript computes, plots, notifies and simulates; order placement stays with the platform's order rules and the trader.
- Every script is a series of expressions on bars. Inputs, definitions and plots recalculate for each bar; offsets and defaults decide whether a result is honest or repaints.
- Alerts have a periodicity. Once, once per bar or every tick, and script alerts need the chart open.
- Test in paperMoney and read the strategy report before trusting any rule with capital.
What thinkScript Can and Cannot Automate
| Capability | What thinkScript does | What it does not do |
|---|---|---|
| Studies | Compute and plot any series, colour bars, add labels, arrows and clouds from your own logic | Nothing outside the chart it is applied to |
| Alerts | Show a message and play a sound when a condition is true, once, per bar or per tick | Fire when the platform or chart is closed (script alerts need the chart open) |
| Strategies | Simulate orders on historical bars with AddOrder and produce a strategy report of hypothetical trades | Send those orders to the market |
| Order automation | Order rules in the Trade tab can hold a working order until a condition, including a study-based one, is met | Run a fully autonomous algorithm; every order is still a user-created order with the platform's controls |
| Data | Price, volume, fundamentals and secondary aggregation periods for the charted symbol | Loop over a watchlist, call external services or store state between sessions |
The historical footnote matters for finding documentation: thinkorswim was TD Ameritrade's platform and is now Charles Schwab's, and the thinkScript Learning Center reference remains the authoritative source for every function and constant used below. Our companion guide to thinkScript basics covers syntax from first principles; this article assumes that and concentrates on automation.
The Editor and the IDE
There are two places to write code. From any chart, the Studies menu leads to Edit Studies and a Create button that opens the thinkScript editor with a default one-line script; this is the quickest route for a study that belongs to one chart layout. The thinkScript IDE, under the Tools tab, is the dedicated environment: it lists predefined and user-defined studies and strategies, lets you duplicate a predefined script and save it under your own name to learn from Schwab's implementations, and imports scripts from files with the .ts extension. Only user-defined scripts can be edited, which is why duplicating a built-in is the standard way to start from a working example.
Four Building Blocks
Inputs, Definitions and a Crossover Study
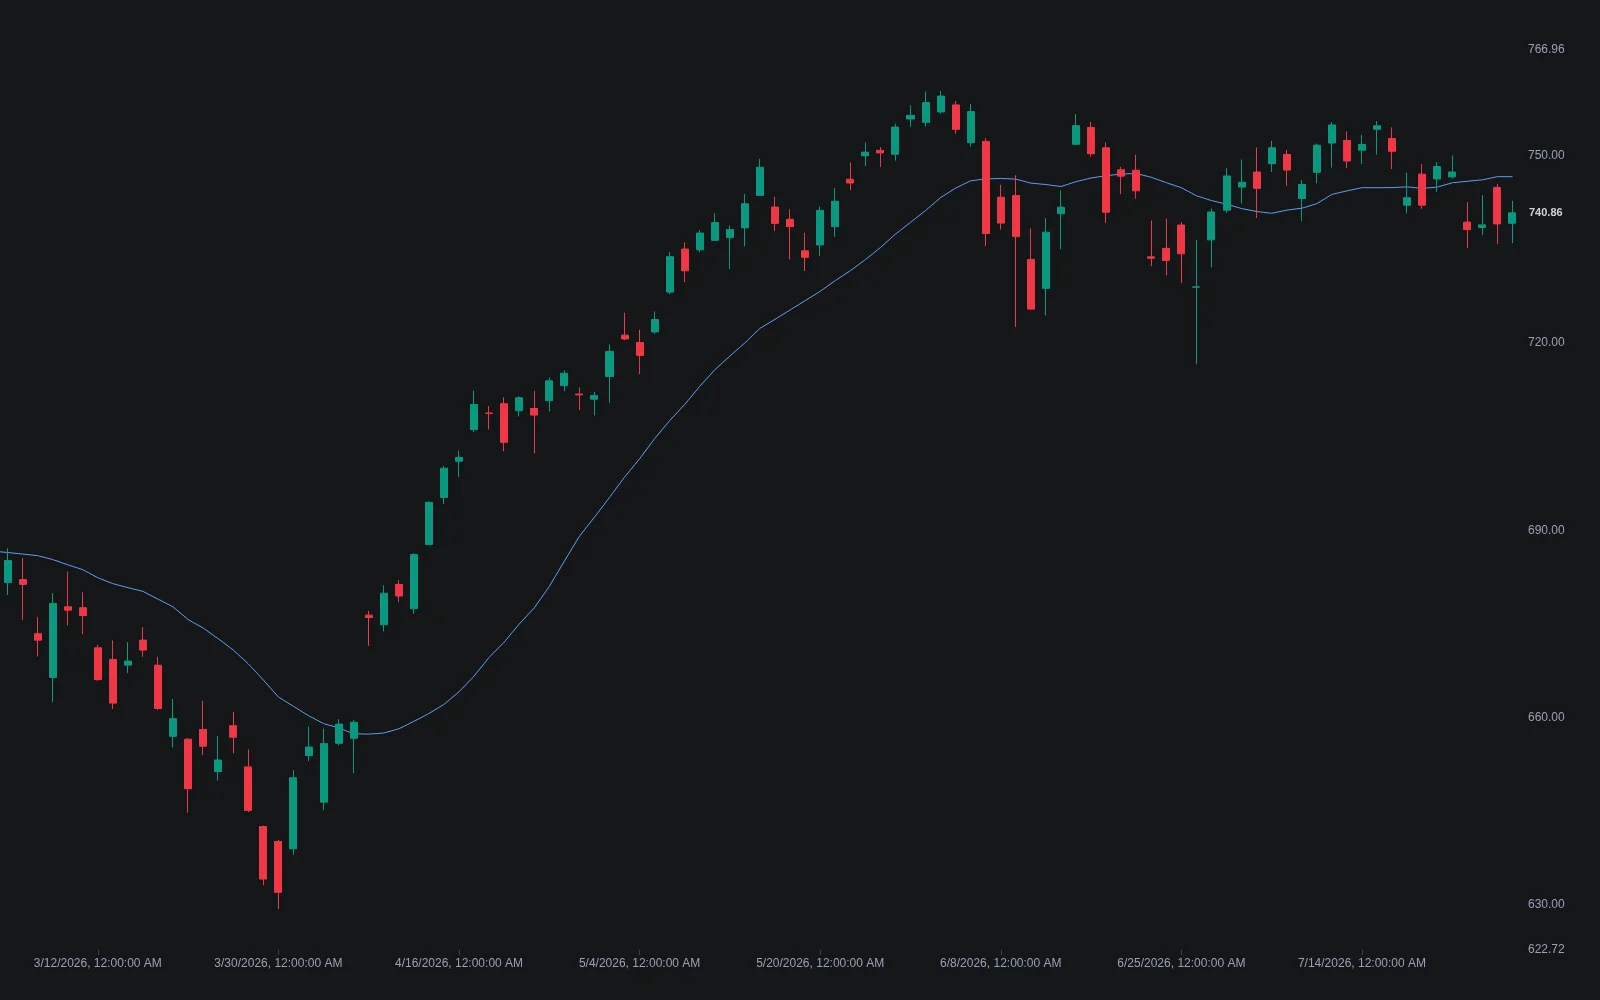
A study is a set of expressions evaluated bar by bar. Inputs expose parameters in the settings dialog, definitions hold intermediate series, plots draw. The crossover below uses the reserved word for crossings in the direction you specify and draws arrows on the bar where the cross occurs.
input fastLength = 20;
input slowLength = 50;
input price = close;
input averageType = AverageType.EXPONENTIAL;

def fastMA = MovingAverage(averageType, price, fastLength);
def slowMA = MovingAverage(averageType, price, slowLength);

plot Fast = fastMA;
plot Slow = slowMA;
Fast.SetDefaultColor(Color.CYAN);
Slow.SetDefaultColor(Color.ORANGE);

plot BullCross = crosses(fastMA, slowMA, CrossingDirection.ABOVE);
plot BearCross = crosses(fastMA, slowMA, CrossingDirection.BELOW);
BullCross.SetPaintingStrategy(PaintingStrategy.BOOLEAN_ARROW_UP);
BearCross.SetPaintingStrategy(PaintingStrategy.BOOLEAN_ARROW_DOWN);
BullCross.SetDefaultColor(Color.GREEN);
BearCross.SetDefaultColor(Color.RED);
Two habits from this snippet carry through everything else. Keep every tunable value an input, so the same study can be tested with different lengths without editing code. And prefer the built-in crossing test to writing the comparison by hand, since it handles the equality edge cases for you.
A Volume-Spike Alert Study
The alert function takes a condition, a message, an alert type and a sound; its default type fires once, and a study may consist of nothing but an alert call. This study flags a bar whose volume exceeds a multiple of its recent average, colours the bar, and alerts once per bar.
input length = 20;
input multiplier = 2.0;

def avgVolume = Average(volume, length);
def spike = volume > avgVolume * multiplier;

plot Spike = spike;
Spike.SetPaintingStrategy(PaintingStrategy.BOOLEAN_ARROW_UP);
Spike.SetDefaultColor(Color.YELLOW);

AssignPriceColor(if spike then Color.YELLOW else Color.CURRENT);

Alert(spike, "Volume spike: " + Round(volume / avgVolume, 1) + "x average", Alert.BAR, Sound.Ding);
The Library's volume spike entry covers how the threshold is usually chosen and why relative volume beats an absolute level. One caveat from the reference: when the alert condition calls another function, it is evaluated at the last real bar, so an alert designed to check earlier bars needs its logic written into the condition explicitly.
A Strategy with AddOrder
Strategies are studies that call AddOrder. The function takes an order type, a condition, a price, a trade size, two colours and a name, and adds an order for the next bar when the condition is true; its default price is the next bar's open, which is what makes the simulation honest, since a signal computed on a completed bar cannot fill at that bar's close. The strategy report in the chart's strategy settings lists every simulated order by name, with entry and exit prices and profit and loss.
input fastLength = 20;
input slowLength = 50;
input rsiLength = 14;
input rsiFilter = 50;

def fastMA = ExpAverage(close, fastLength);
def slowMA = ExpAverage(close, slowLength);
def rsi = RSI(length = rsiLength);

def longSignal = crosses(fastMA, slowMA, CrossingDirection.ABOVE) and rsi > rsiFilter;
def exitSignal = crosses(fastMA, slowMA, CrossingDirection.BELOW);

AddOrder(OrderType.BUY_TO_OPEN, longSignal, open[-1], 100, Color.GREEN, Color.GREEN, "EMA cross long");
AddOrder(OrderType.SELL_TO_CLOSE, exitSignal, open[-1], 100, Color.RED, Color.RED, "EMA cross exit");
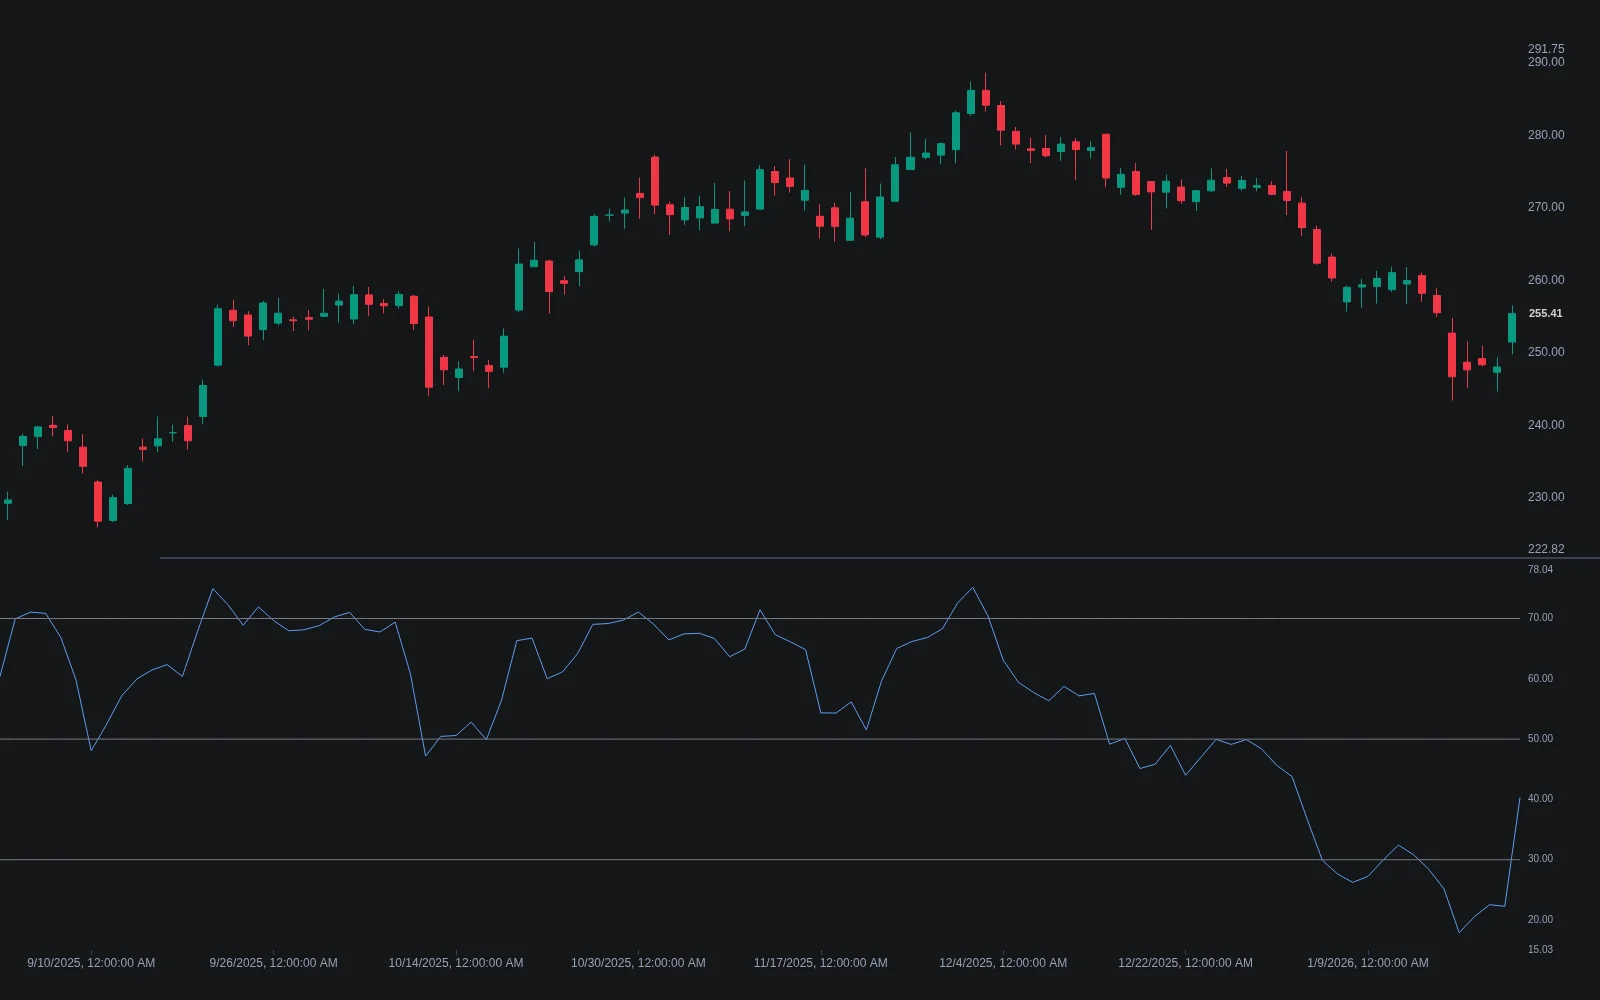
Read the strategy report as a backtest, because that is what it is: hypothetical fills at the next bar's open, with no commission, slippage or partial fills unless you account for them yourself. The Library's Relative Strength Index entry explains the momentum filter used here and why the fifty line separates buyer-led from seller-led momentum.
Alert Types and Where They Run
| Mechanism | How it fires | Runs when | Use it for |
|---|---|---|---|
| Script alert, once | The default alert type: the first time the condition is true | Chart with the study open | One-off events such as a level being reached |
| Script alert, per bar | At most once for each bar on which the condition is true | Chart with the study open | Signals such as a crossover or a volume spike |
| Script alert, per tick | On every tick while the condition is true | Chart with the study open | Rarely; it is noisy by design |
| Platform alert on a study | Created in the platform's alerts tool from a study condition, with notification options | The platform's servers, chart not required | Signals you want delivered when you are away |
| Order rule | A working order submits when a condition is met | The platform, subject to its order controls | Conditional entries and exits you have decided in advance |
Testing and the Classic Mistakes
Schwab's paperMoney environment runs the same platform on simulated money, which is where every study, alert and strategy should live first. Beyond that, five mistakes account for most thinkScript disappointments.
- Trusting a repainting signal. A condition that references the current bar's close changes until the bar completes. Evaluate signals on completed bars, or accept that the arrow you see intrabar may vanish.
- Filling at the signal bar. Overriding AddOrder's default price with the current close fills a trade at a price that was not known when the signal fired. Leave the next-bar open, or model something worse.
- Secondary aggregation lookahead. Pulling a higher-timeframe value onto a lower-timeframe chart can expose a bar's close before it has happened. Reference the previous completed higher-timeframe bar.
- Ignoring costs. The strategy report contains no commission or slippage. A rule that trades often and shows a thin edge will not survive them.
- Optimising to the chart. Adjusting lengths until the visible history looks good is curve fitting. Fix the parameters, then look at a symbol and period you did not tune on. Our guide to backtesting traps covers the general case.
thinkScript, Pine Script and Quant
| Aspect | thinkScript | Pine Script on TradingView | Quant on Quant Charts |
|---|---|---|---|
| Who writes the code | You, in the editor or IDE | You, in the Pine editor | Quant, from your description; you read it in Code |
| Studies | def and plot with painting strategies | plot, plotshape, bgcolor | Any indicator Quant writes, plus the Library |
| Strategies | AddOrder and the strategy report | strategy.entry and the Strategy Tester | Run produces the Backtest Summary: net profit, trade count, win rate, maximum drawdown, profit factor |
| Costs | Not modelled in the report | Commission and slippage in strategy properties | Commission and slippage in strategy properties |
| Alerts | Alert function and platform alerts | alertcondition and strategy alerts | Alerts on chart conditions |
| Order placement | None from script; order rules in the platform | None from script | None; no LuxAlgo tool places orders |
| Reuse elsewhere | Export .ts files | Copy source | Pine Script runs in PineTS, LuxAlgo's TypeScript implementation |
Our guides to the best programming languages for algorithmic trading and MQL programming place thinkScript among the platform languages, and the Python libraries guide covers what to reach for when a chart language runs out.
Where Quant Charts Fits
Everything in the strategy above is a sentence. Say it to Quant, buy when the twenty-period exponential average crosses above the fifty while the fourteen-period RSI is above fifty, and exit on the opposite cross, and Quant writes the indicator or strategy in Pine Script and plots it on the active Quant Charts symbol. Open Code to read the logic line by line, exactly as you would review a thinkScript study, and click Run: the Backtest Summary reports net profit, trade count, win rate, maximum drawdown and profit factor, with commission and slippage set in the strategy properties, which is the cost accounting the thinkorswim strategy report leaves to you. Library indicators such as the Moving Average and Relative Strength Index load in a click for the visual read, and the Making Strategies with Quant guide walks through the workflow. For code you want to run outside a chart, PineTS is LuxAlgo's TypeScript implementation of Pine Script, so the same strategy logic can run in a TypeScript pipeline.
One boundary. The LuxAlgo platform does not place orders for you, just as thinkScript does not; Quant Charts is where rules are written and tested, and execution stays with your broker.
Conclusion
thinkScript automates analysis, notification and simulation on thinkorswim: studies that compute and draw, alerts with a chosen periodicity, and strategies whose AddOrder calls produce a report of hypothetical trades at the next bar's open. It does not place orders, and its report does not charge costs, so the trader's job is to test in paperMoney, avoid repainting and lookahead, and account for friction before believing a result. The same rules translate directly to Quant Charts, where Quant writes them from a description, Code shows the logic and the Backtest Summary reports the outcome with commission and slippage included.
Key Takeaways
- Three automations. Studies, alerts and AddOrder strategies; order placement stays with the platform's order rules.
- Inputs for every parameter and the built-in crossing test for every crossover.
- Alerts have a type. Once, per bar or per tick, and script alerts need the chart open; platform alerts do not.
- The strategy report is a costless backtest. Keep the next-bar-open fill and add costs yourself.
- Same rule, Quant Charts. Quant writes it, Code shows it, Run reports it with costs; no LuxAlgo tool places orders.
FAQs
Can thinkScript place trades automatically?
No. thinkScript computes studies, fires alerts and simulates strategies with AddOrder, which produces a strategy report of hypothetical trades rather than live orders. The only conditional automation thinkorswim offers is an order rule that holds a working order until a condition is met, and every such order is still created and controlled by the trader within the platform.
What is the difference between a study and a strategy in thinkScript?
A study plots and colours values derived from price and volume and can fire alerts. A strategy is a study that calls AddOrder to simulate entries and exits on historical bars, filling by default at the next bar's open and listing the results in the strategy report. Both are written in the same editor or the thinkScript IDE.
How do thinkScript alerts work?
The Alert function takes a condition, a message, an alert type and a sound. The default type fires once; Alert.BAR fires at most once per bar and Alert.TICK on every tick while the condition holds. Script alerts need the chart with the study open. Platform alerts created in the alerts tool from a study condition run on Schwab's servers and can notify you when the platform is closed.
Why does my thinkScript signal disappear or repaint?
Because it references values that change until the bar completes, or pulls a higher-timeframe value that has not finished forming onto a lower-timeframe chart. Evaluate signals on completed bars, reference the previous completed bar for secondary aggregations, and keep AddOrder's default next-bar-open fill rather than filling at the signal bar's close.
Does the thinkorswim strategy report include commissions and slippage?
No. It lists hypothetical fills at the specified price, by default the next bar's open, with no commission, slippage or partial fills. Treat it as a costless backtest and either model costs yourself or test the same rule where they can be set, as they can in the strategy properties on Quant Charts.
How does Quant Charts compare with thinkScript?
On Quant Charts you describe the rule and Quant, LuxAlgo's coding agent, writes it in Pine Script; Code shows the logic and Run produces the Backtest Summary with net profit, trade count, win rate, maximum drawdown and profit factor, with commission and slippage in the strategy properties. Library indicators load in a click and PineTS runs the same Pine Script in TypeScript. Like thinkScript, no LuxAlgo tool places orders.
References
LuxAlgo Resources
- Quant Charts
- LuxAlgo Quant
- Making Strategies with Quant
- PineTS Documentation
- Moving Average Indicator
- Relative Strength Index Indicator
- Volume Spike Concept
- ThinkScript Basics for Thinkorswim
- Best Programming Languages for Algorithmic Trading
- MQL Programming: Trading Code Essentials
- Python for Algorithmic Trading: Essential Libraries
- Backtesting Traps: Common Errors to Avoid
External Resources
- thinkScript Learning Center — Reference
- thinkScript Learning Center — Tutorials Overview
- thinkScript Reference — Alert
- thinkScript Reference — Alert.BAR
- thinkScript Reference — AddOrder
- thinkScript Tutorials — Strategies
- thinkScript Reference — crosses
- thinkScript Reference — AddLabel
- thinkScript Reference — RSI
- thinkManual — thinkScript IDE
- Charles Schwab — thinkorswim
- Charles Schwab — paperMoney Trading Simulator
Read next