TrendSpider: Charting Tool Breakdown
TrendSpider combines automated chart analysis, market scanning, strategy testing, and cloud alerts. LuxAlgo combines native browser charts with Quant, our coding agent, for developing editable indicators and strategies. Both now offer AI-assisted workflows. The useful comparison is how each helps you define a setup, inspect its evidence, test it, and monitor the right markets.
This review uses official product pages and pricing available September 8, 2026. It separates regular monthly prices from annual equivalents and temporary promotions, and distinguishes research tools from live broker execution.
Quick Comparison
| Workflow | TrendSpider | LuxAlgo |
|---|---|---|
| Chart analysis | Automated trendlines, Fibonacci and pattern recognition, multi-timeframe analysis, dashboards | Native charts, drawings, indicators, Orderflow tools, and multi-chart workspaces |
| AI and custom studies | Sidekick research/scanning/coding assistant; JavaScript custom indicators; separate ML Quant Lab | Quant develops editable indicators and strategies in the native chart environment |
| Market screening | Technical, fundamental, alternative-data and custom-indicator scans; plan-dependent limits | Native watchlists, with Library tools on any Quant Chart |
| Strategy research | Visual strategy builder, multi-symbol tests, variance testing, costs and slippage | Quant strategy simulations, backtested against years of history |
| Alerts and execution | Cloud alerts and Strategy Bots; configured SignalStack connections for supported broker routing | Product-specific alerts and separately configured automation; a native backtest is not a live order |
| Standard monthly pricing | Standard $82; Premium $137; Enhanced $183; Advanced $321 | Free $0; Premium $67.99; Ultimate $119.99; Ultra $229.99 |
1. TrendSpider Platform Review
Automated Charting and Multi-Timeframe Analysis
TrendSpider provides browser-based chart analysis with automated trendlines, Fibonacci levels, support/resistance zones, and chart-pattern detection. Its multi-timeframe analysis helps place shorter-term price behavior in a broader context, such as comparing an intraday setup with a daily trend.
Automated drawing reduces repetitive work, but the selected lookback, swing points, timeframe, and pattern rules still shape the output. A detected trendline is a model interpretation, not proof that a breakout or reversal will follow. The older claim of up to 2,000 trendlines is not used here as a current plan entitlement; the practical question is whether the relevant levels and controls fit your process.
The chart-analysis overview describes hundreds of built-in indicators, custom studies, dashboards, seasonality profiles, and Smart Checklists. Official pages currently use different indicator totals, so compare the named studies you need instead of choosing a platform by a headline count.
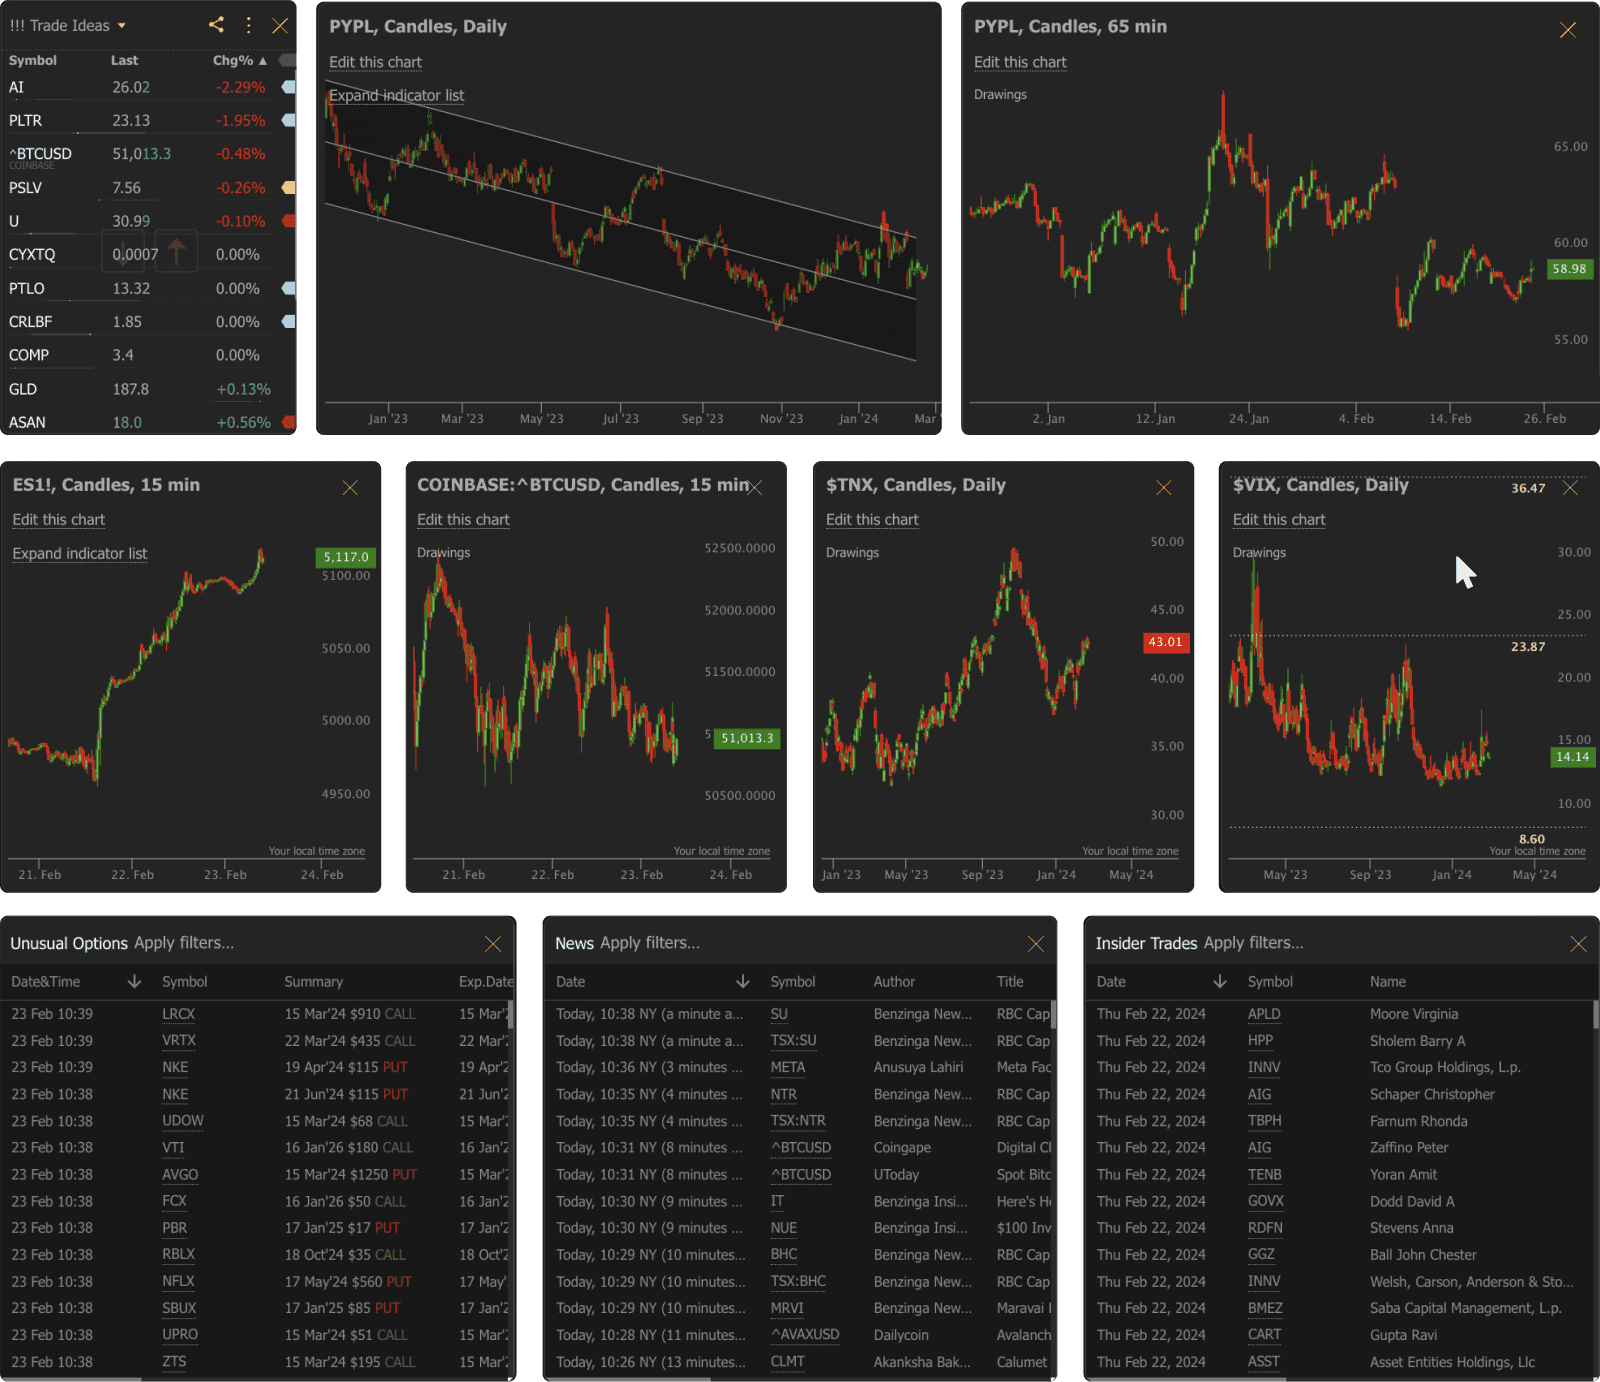
Dashboards combine charts, watchlists, scanners, and data-flow widgets. Smart Checklists evaluate a saved set of conditions when reviewing a chart, displaying whether those conditions are met. A checklist result supports consistent review; it is not an order or a guarantee that the setup will work.
Scanning, Smart Watchlists, and Alternative Data
The market-scanning tools combine technical, fundamental, and alternative-data conditions. They support multiple timeframes, custom indicators, scheduled scans, and more than 700 automatically generated smart watchlists. Sidekick can help build and refine scanner conditions, but you should inspect what it actually configured.
A condition scan and a strategy comparison answer different questions. The first finds symbols meeting a rule; the second compares historical strategy behavior across a selected universe. TrendSpider advertises up to 510 symbols per strategy test on Advanced, with lower limits on other plans. That is not the same as promising unlimited historical testing across every market.
Available research includes corporate fundamentals, analyst estimates, insider filings, unusual options flow, dark-pool information, news, and Federal Reserve Economic Data (FRED). The original fixed count of 5,000 FRED datasets is omitted because the current overview does not establish that as a plan limit. Verify the specific series, release schedule, and revisions needed for a macroeconomic study.
Use the timestamp when information became available. An insider transaction is generally seen through a later disclosure; it is not a live view into the person’s account. An options block or sweep can be part of a spread or hedge and does not prove a participant’s net direction. Historical tests using fundamentals or alternative data must avoid treating later releases as earlier knowledge.
Sidekick, JavaScript, and ML Quant Lab
Sidekick supports chart and fundamental research, scanner creation, alert configuration, and custom-indicator development. The developer overview describes JavaScript studies that can be used beyond charts in scanning, strategies, alerts, and bots. TrendSpider should therefore not be reduced to automatic trendline plotting in a comparison of AI tools.
ML Quant Lab is another workflow: users choose training inputs, model type, horizon, and target behavior, then train and evaluate a model. Training a machine-learning model differs from asking an assistant to write a deterministic indicator. A target such as a specified percentage move is a training objective, not a promised return. Keep evaluation data separate and check whether the inputs were available at the time.
Strategy Development and Backtesting
TrendSpider’s Strategy Tester supports rules built through visual menus or language assistance, including conditions based on custom JavaScript indicators. Multi-symbol and variance testing help compare configurations; costs, slippage, and trade-level results help assess what a favorable summary may conceal.
The advertised “50+ years” of history should not be read as 50 years of one-minute testing on every symbol and plan. Available history depends on the asset and timeframe, and the plan imposes a bar-depth limit. The current standard limits are:
| Plan | Smallest backtest timeframe | Backtest depth | Symbols per test | Smallest scanning timeframe |
|---|---|---|---|---|
| Standard | 2 hours | 2,000 bars | 50 | 2 hours |
| Premium | 5 minutes | 10,000 bars | 150 | 5 minutes |
| Enhanced | 1 minute | 20,000 bars | 250 | 1 minute |
| Advanced | 1 minute | 30,000 bars | 510 | 1 minute |
One-minute charting is listed on every plan, but one-minute backtesting is not. Choose the plan around the timeframe and history needed for your test. An optional depth upgrade is listed for Standard and Premium; verify its effect on depth and other limits separately instead of assuming it changes the entire plan.
Testing many combinations increases the chance of finding an attractive result by luck. Keep an untouched later period, compare reasonable parameter variations, and examine drawdown, costs, and losing trades. A model or rule selected because it performed best in the same sample still needs independent evaluation.
Cloud Alerts, Bots, and Broker Routing
TrendSpider’s alert and execution overview distinguishes dynamic alerts on levels or indicators, multi-factor conditions across timeframes, and Strategy Bots. Alerts run in the cloud, so the TrendSpider browser window does not need to remain open. Delivery options include push notifications, email, text, and in-app messages.
Strategy Bots can monitor entries and exits or feed configured automation. Supported broker connections use SignalStack, including the platform’s trading interface. Creating a bot or receiving an alert is not the same as a broker accepting and filling an order. Confirm account support, order types, routing capacity, and behavior when conditions or connections fail.
The current plan table lists 5, 10, 50, and 100 bots from Standard through Advanced, and 10, 50, 100, and 400 alerts respectively. It also lists five free automated orders per month. Additional routing, market data, and account requirements can affect the total cost; do not confuse the number of bots with unlimited executed orders.
2. LuxAlgo Platform Review
Native Charts and Quant
LuxAlgo charts bring market analysis, drawings, indicators, and Quant into a native browser workspace. You can work from an existing Library study or describe a precise custom idea, inspect the resulting code, and test its behavior on the chart.
For example, define a daily trend filter and an hourly pullback entry. Specify the moving-average periods, whether each condition uses a completed candle, the entry timing, and the exit rule. Ask Quant to implement the study or strategy, then review Code and Run and check Inputs and Properties.
The daily condition must use information available at the hourly decision point. Using the final daily close earlier in the session would introduce look-ahead bias. An indicator that marks the setup is not automatically a strategy that simulates orders. Include costs, inspect individual trades, and test a later period before drawing conclusions.
This is a direct use case for LuxAlgo: turn a chart observation into explicit, editable rules while keeping the implementation and results close to the chart. It does not imply that Quant reproduces TrendSpider’s scanners, JavaScript runtime, ML training, or live broker routing.
Workspaces and Watchlists
Organize research by purpose. A workspace for a daily trend study can use a different layout and set of indicators from an intraday pullback experiment. The short clip below demonstrates LuxAlgo’s workspace interface; it shows organization and navigation rather than a trading result.
Native watchlists keep the symbols you are reviewing beside the chart. Selecting a symbol changes the active chart, while the advanced view provides a more detailed overview. A watchlist is useful for organizing a chosen universe; it should not be presented as equivalent to TrendSpider’s fundamental and alternative-data market scanner.

Market Data and Orderflow
LuxAlgo’s data guide distinguishes candle history, footprint data, and plan limits. Supported crypto venues and U.S. equities through Cboe EDGX provide pre-aggregated one-minute footprint data. EDGX is not consolidated U.S. market volume. Paid forex, commodities, and CME feeds provide candles rather than the same footprint coverage.
Candle-based TPO, VWAP, and Visible Range Profile remain distinct from an exchange order book. Similarly, native order-flow tools should not be equated with TrendSpider’s unusual options flow, corporate fundamentals, or insider disclosures. Match the tool to the information needed for the strategy.
Pricing and Total Cost
TrendSpider Regular Prices
| Plan | Regular monthly billing | Regular annual total | Monthly equivalent billed annually |
|---|---|---|---|
| Standard | $82 | $648 | $54 |
| Premium | $137 | $1,092 | $91 |
| Enhanced | $183 | $1,464 | $122 |
| Advanced | $321 | $2,568 | $214 |
These regular prices were verified in TrendSpider’s pricing and billing selector during a temporary promotion. Promotional introductory amounts are excluded from this comparison because their duration and renewal terms differ. The original $54 starting figure is an annual equivalent, not the regular month-to-month Standard price.
Plan capacity also matters: Standard through Advanced list 5, 10, 15, and 20 open workspaces. Support priority and included training vary. All main plans include 25 Sidekick messages per month; optional Basic, Plus, and Max Sidekick subscriptions are listed at $49, $129, and $349 monthly for higher message allowances. The $349 figure should not be used as the top main-charting-plan price.
The pricing page lists non-professional real-time futures data at $7.50 per month and OPRA options at $9.50 per month; professional U.S. equities data adds $29 per month. It also lists a $39 monthly depth upgrade for Standard/Premium. Confirm classification, required feeds, taxes, and any routing or third-party add-ons before comparing the final bill.
LuxAlgo Monthly and Annual Plans
| Plan | Monthly billing | Annual total | Monthly equivalent billed annually |
|---|---|---|---|
| Free | $0 | $0 | $0 |
| Premium | $67.99 | $479.88 | $39.99 |
| Ultimate | $119.99 | $719.88 | $59.99 |
| Ultra | $229.99 | $1,439.88 | $119.99 |
These standard LuxAlgo prices exclude temporary promotions. Monthly credits are 500 on Free, 5,000 on Premium, 25,000 on Ultimate, and 100,000 on Ultra. Annual equivalents are not month-to-month prices. Check the current plan’s data, history, layout, and separate-product entitlements.
A similarly named plan on another platform does not imply equivalent testing depth, scanner capacity, AI allowance, or execution support. Compare the tools and limits required for the actual workflow.
Choosing a Platform for Your Trading Process
- Choose TrendSpider when the central requirement is combining technical, fundamental, and alternative-data scans with its visual Strategy Tester and cloud alerts. Confirm that the plan supports your timeframe and historical depth.
- Choose LuxAlgo when the priority is native chart research and developing editable indicators or strategies with Quant. Start with a precisely defined example and review the implementation and simulated trades.
- For automation, evaluate the entire chain: condition, alert, route, broker acceptance, and actual fill. A backtest or notification alone does not establish successful execution.
- For beginners, start with one market and one method. Browser access and AI assistance reduce some setup work but do not remove the need to understand the strategy, its data, and its failure cases.
Both platforms provide education and support communities. TrendSpider offers its University, documentation, and plan-dependent training; LuxAlgo offers product documentation, tutorials, and its community. Community examples can help you learn a workflow, but an unattributed testimonial or a selected winning chart is not evidence of typical customer returns.
A fair trial uses the same symbol, feed or exchange where possible, session, timeframe, cost assumptions, and evaluation period. Record the time needed to build the setup, the mistakes found during review, and how easily you can explain each trade. LuxAlgo is particularly compelling when you want to move from chart observation to editable strategy research, while TrendSpider adds depth for users whose process depends on its scanning and alternative-data tools.
FAQs
Is TrendSpider Standard $54 per month?
The regular Standard price checked for this review is $82 with monthly billing. The $54 figure is the monthly equivalent of a $648 annual subscription. Temporary introductory promotions have separate renewal terms.
Does TrendSpider provide 50 years of one-minute backtesting on every plan?
No. Available history depends on the asset and timeframe, and plan limits apply. Standard lists two-hour minimum backtests and 2,000 bars; Premium five-minute tests and 10,000 bars; Enhanced and Advanced one-minute tests with 20,000 and 30,000 bars respectively.
How does Quant differ from TrendSpider Sidekick?
Quant, our coding agent, develops editable indicators and strategies in LuxAlgo’s native chart environment. TrendSpider Sidekick supports research, scanners, alerts, and custom JavaScript indicators in TrendSpider. Both require review, and neither AI output or historical backtest guarantees profitable live execution.
References
- TrendSpider: current plans and limits
- TrendSpider: charting and data analysis
- TrendSpider: scanning and smart watchlists
- TrendSpider: strategy testing
- TrendSpider: cloud alerts and routing
- TrendSpider: JavaScript and AI coding
- LuxAlgo: developing strategies with Quant
- LuxAlgo: native strategy simulations
- LuxAlgo: data and history
- LuxAlgo: current plans
Read next