How to Use Volume for Trend Confirmation
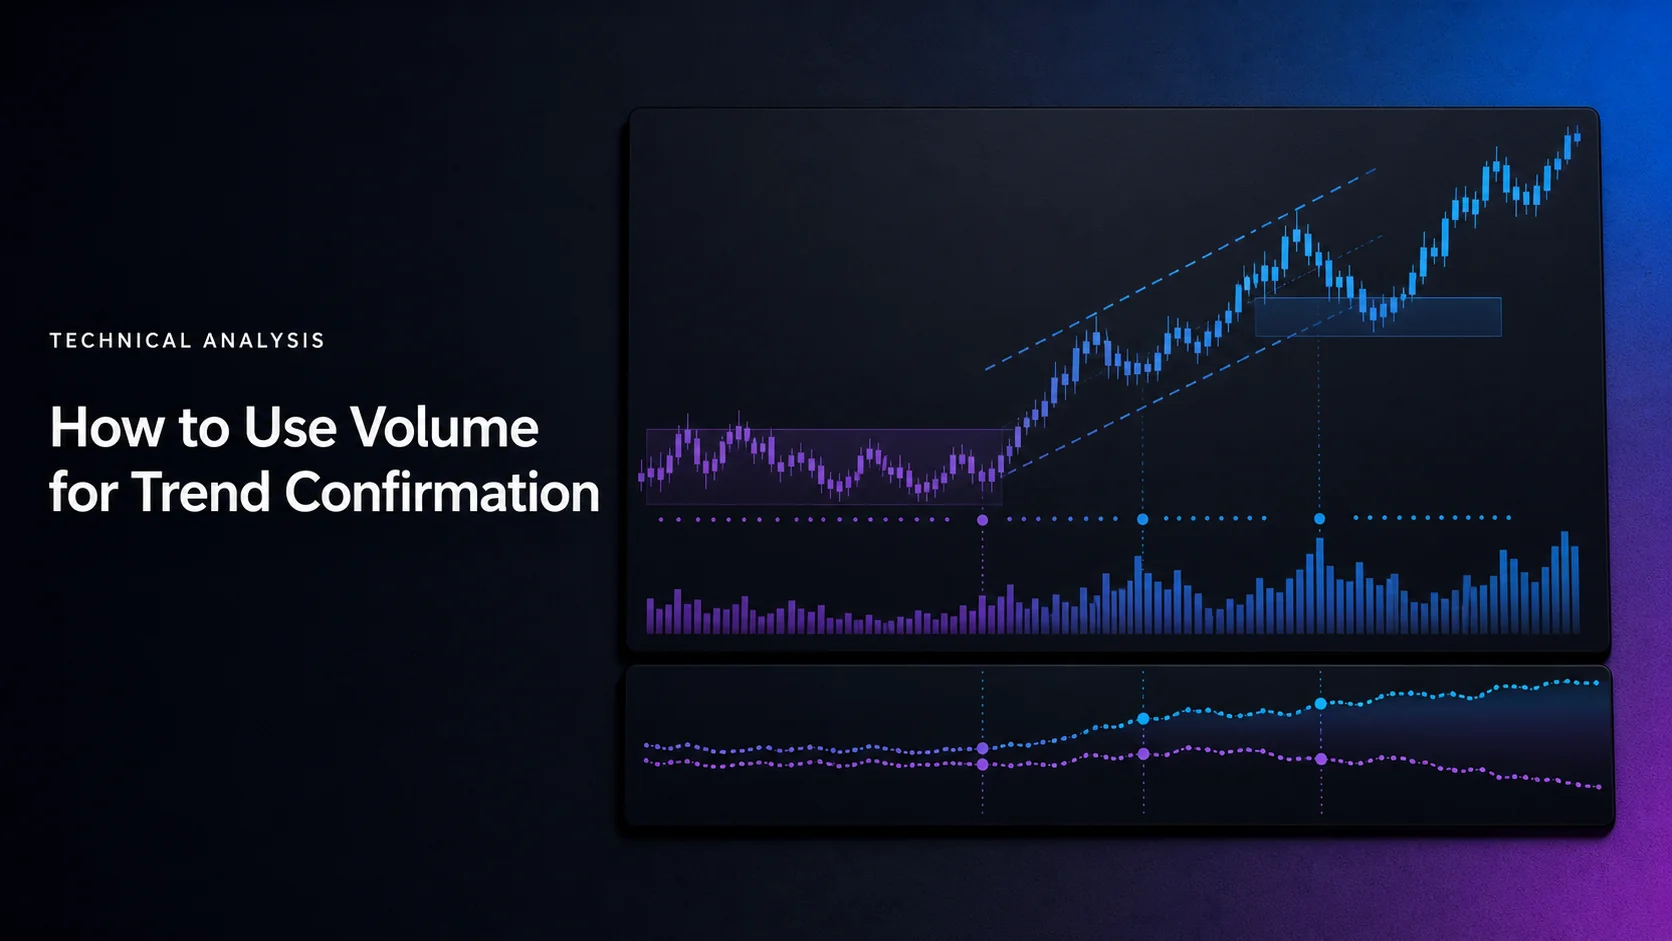
Volume confirmation means assessing whether trading activity supports your interpretation of a price trend. It adds context to rising prices, falling prices, and breakouts, but does not establish that a trend will continue or reverse.
Start with a clear trend definition and a comparable volume baseline. Use LuxAlgo’s native charts to inspect the relationship, then work with Quant to test a specific volume condition against the same strategy without it. This turns a visual impression into a rule you can evaluate.
Volume Measures Quantity, Not the Number of Trades
Trading volume commonly counts shares, contracts, or asset units exchanged during a period. Trade count measures the number of executions. Ten trades of 100 shares each and one trade of 1,000 shares have the same volume but different trade counts. Neither tells you how many unique traders participated.
Some forex feeds report tick activity rather than consolidated traded quantity. Crypto volume depends on venue, instrument, and units; stock feeds can differ in coverage. Compare the same series and session, and distinguish missing data from low activity.
LuxAlgo’s native Trade Count tools specifically count prints and require footprint data with trade counts. Missing counts leave gaps, and the tools require fixed-duration bars rather than monthly timeframes. A large print or high average trade size does not by itself identify an institution.
Read Price and Volume Together
| Observation | Useful interpretation | Limit |
|---|---|---|
| Rising price and rising volume | More reported activity accompanied the advance | The move can still reverse or become exhausted |
| Falling price and rising volume | More activity accompanied the decline | It does not automatically establish a short entry |
| Price advances on lower volume | The advance attracted less activity against the selected baseline | Lower volume alone does not time a reversal |
| Price declines on lower volume | The decline occurred with less reported activity | Selling is not proven to be exhausted |
| Sideways price and a volume spike | Activity increased without a resolved range break | Direction and participant motives remain uncertain |
These are observations to investigate, not probability estimates. Every executed trade has a buyer and seller. A volume bar colored by price direction does not classify all of its quantity as aggressive buying or selling.
Define the Comparison
If a completed session trades 1.5 million shares against an average of 1 million over the preceding 20 sessions, relative volume is 1.5: 150% of average, or a 50% increase. This hypothetical example shows unusual activity, not proof that buyers will drive another advance.
Specify the lookback and exclude the current signal bar from the comparison average if that is your intended rule. Intraday, compare equivalent points in prior sessions. Relative Volume at Time illustrates regular-bar versus cumulative-session comparisons. An unfinished bar has not accumulated its final volume.
Trend Continuation, Divergence, and Breakouts
Assess Continuation
In an uptrend, traders often examine whether advances attract more activity than pullbacks. In a downtrend, they may compare declines with countertrend rallies. Define which swings or bars belong to each group rather than choosing favorable examples afterward.
Keep the price trend explicit: higher highs and higher lows, a moving-average condition, or another reproducible rule. Volume can be an additional filter, but it should not silently change the definition of the trend whenever a signal fails.
Interpret Divergence Carefully
A new price high accompanied by lower comparable volume, or a lower OBV high, is a possible divergence. A new price low accompanied by weaker downside activity is another pattern to investigate. State whether you are comparing individual bars, entire swings, or an indicator.
Divergence can persist while price keeps trending. It is a reason to examine structure and risk, not an automatic instruction to reverse a position. If your exit requires a broken swing low, a moving-average cross, or another event, wait for that defined event rather than treating divergence as a guaranteed turning point.
Evaluate a Breakout
Mark support or resistance before the break. Decide whether a trade through the level, a completed close, or a later retest qualifies. A volume surge 50% above average can be a candidate condition to test; it is not a universal threshold for a genuine breakout.
Follow-through arrives later. A strategy that needs the completed breakout day’s volume cannot assume that total was known earlier in the day. High-volume breaks can fail, while moderate-volume moves can continue. See volume confirmation for breakouts for a worked framework.
Choose Tools That Answer Different Questions
- On-Balance Volume: OBV adds a bar’s volume when its close exceeds the previous close, subtracts it when the close is lower, and is unchanged on an equal close. It is a price-based classification of whole-bar volume, not measured order-flow delta.
- Volume Profile: Shows activity across price levels. Its lookback and data source affect the result; a busy price zone does not guarantee future support or resistance.
- VWAP: Weights a selected price measure by volume over an anchored window. It is a reference price, not intrinsic value or every participant’s cost basis.
- RSI and MACD: Add price-momentum context. Because they reuse price information, agreement is not independent proof that a volume signal will work.
Native LuxAlgo Charts and Volume Delta
LuxAlgo is a full charting platform. On supported data, Volume Delta and Cumulative Volume Delta add side-classified execution context. Check data coverage and the reset window before comparing their readings with price.
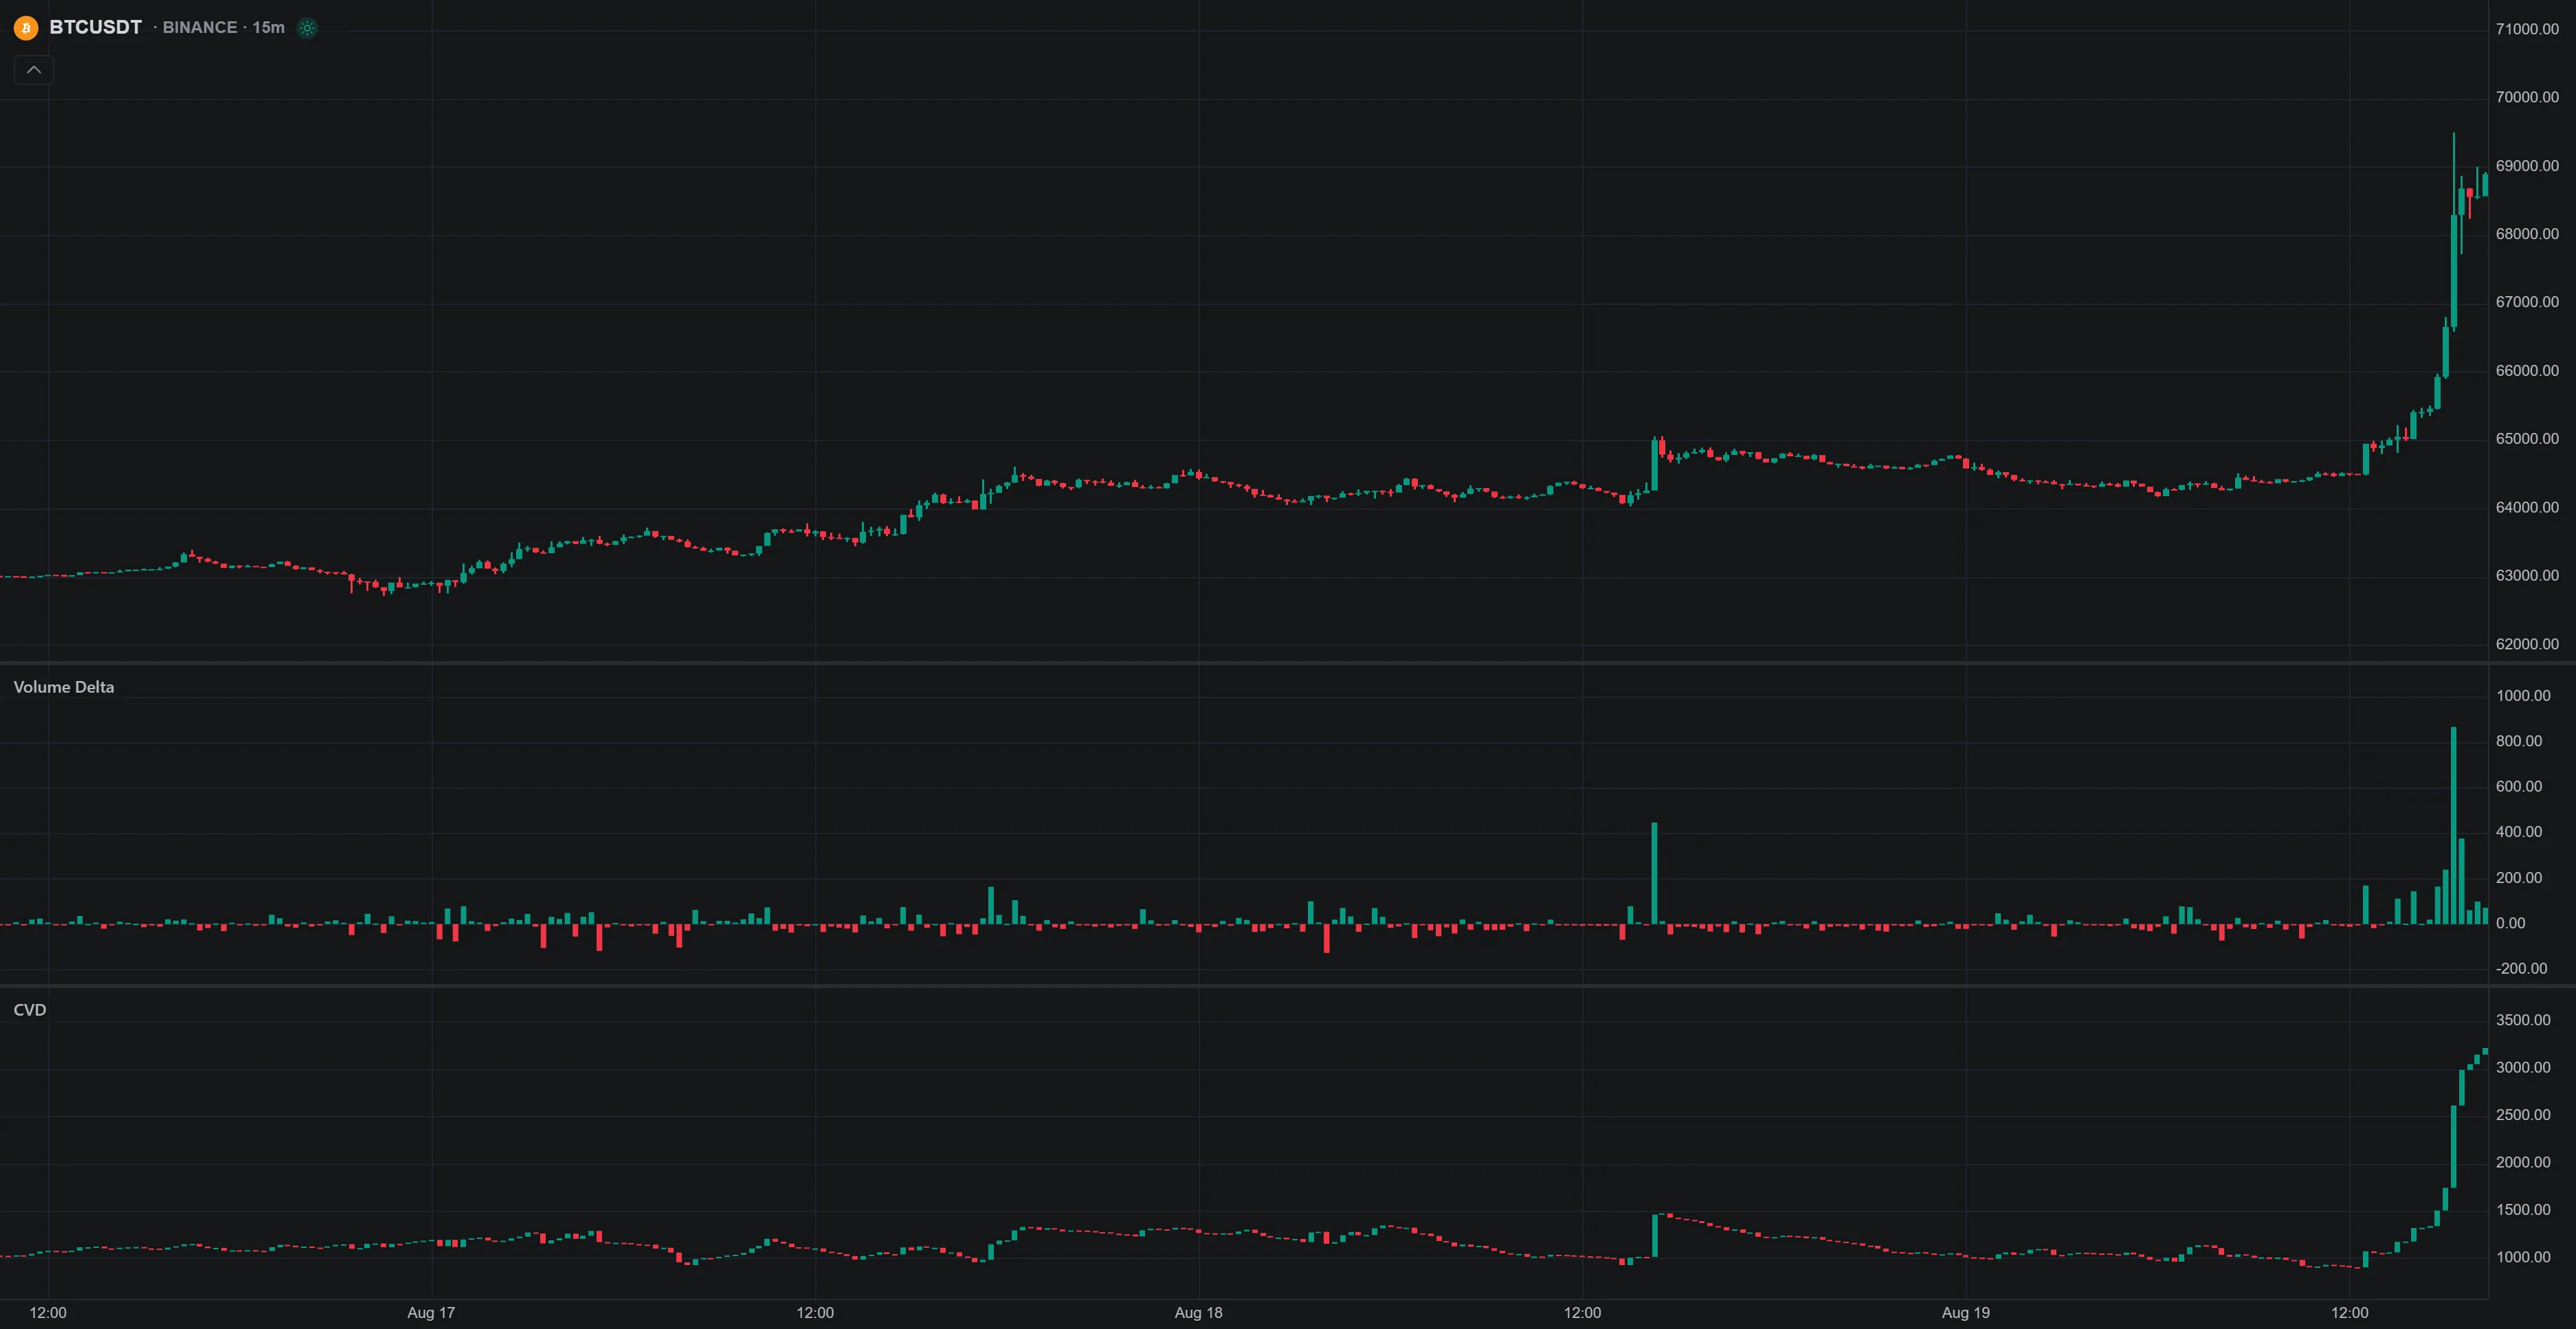
Native Volume Profiles distinguish candle-based Visible Range from footprint-based Session and Rolling profiles. Native VWAP offers UTC Day, Week, and Month anchors. Select these settings deliberately rather than assuming every volume tool uses the same data or session.
Test Whether Volume Improves Your Trend Rule
Give Quant the trend definition, entry timing, volume baseline, filter threshold, exit conditions, and sizing rule. Ask it to expose parameters and review the generated logic. Compare the same strategy with and without the volume condition using native strategy properties and results.
Include commission and slippage, inspect individual fills, and compare net performance and drawdown alongside win rate. A filter may improve the average trade while excluding enough opportunities to reduce overall returns. Reserve a later period for validation and examine nearby thresholds to avoid relying on one favorable setting.
Set risk independently of how convincing the volume looks. For an illustrative $50 entry, $48 planned stop, and $200 risk budget, allowing $0.10 per share for estimated costs and adverse execution gives floor($200 ÷ $2.10) = 95 shares, or $199.50 planned risk. Worse execution can exceed that estimate. Volume confirmation does not make a stop fill guaranteed.
Video: Comparing Volume at Similar Times
This Trade Nation + TradingView tutorial demonstrates a time-matched volume comparison. The interface is TradingView; the measurement concept helps explain why comparable periods matter.
FAQs
What is volume confirmation?
Volume confirmation is the use of trading activity to support a price-trend interpretation. It requires a defined baseline and does not guarantee continuation or reversal.
What is an example of volume confirmation?
A hypothetical stock rises through a premarked resistance level while completed-session volume reaches 1.5 million shares against a prior average of 1 million. Activity is 50% above average. That can meet a predefined volume filter, but the trade’s outcome remains uncertain.
How to use volume to confirm trend?
Define the price trend, compare activity on equivalent bars or swings, and test an explicit volume condition alongside entry and exit rules. Consider data quality, costs, and separate validation periods instead of assuming rising volume ensures continuation.
References
Read next