V Bottoms & Tops: Identify Trend Reversals
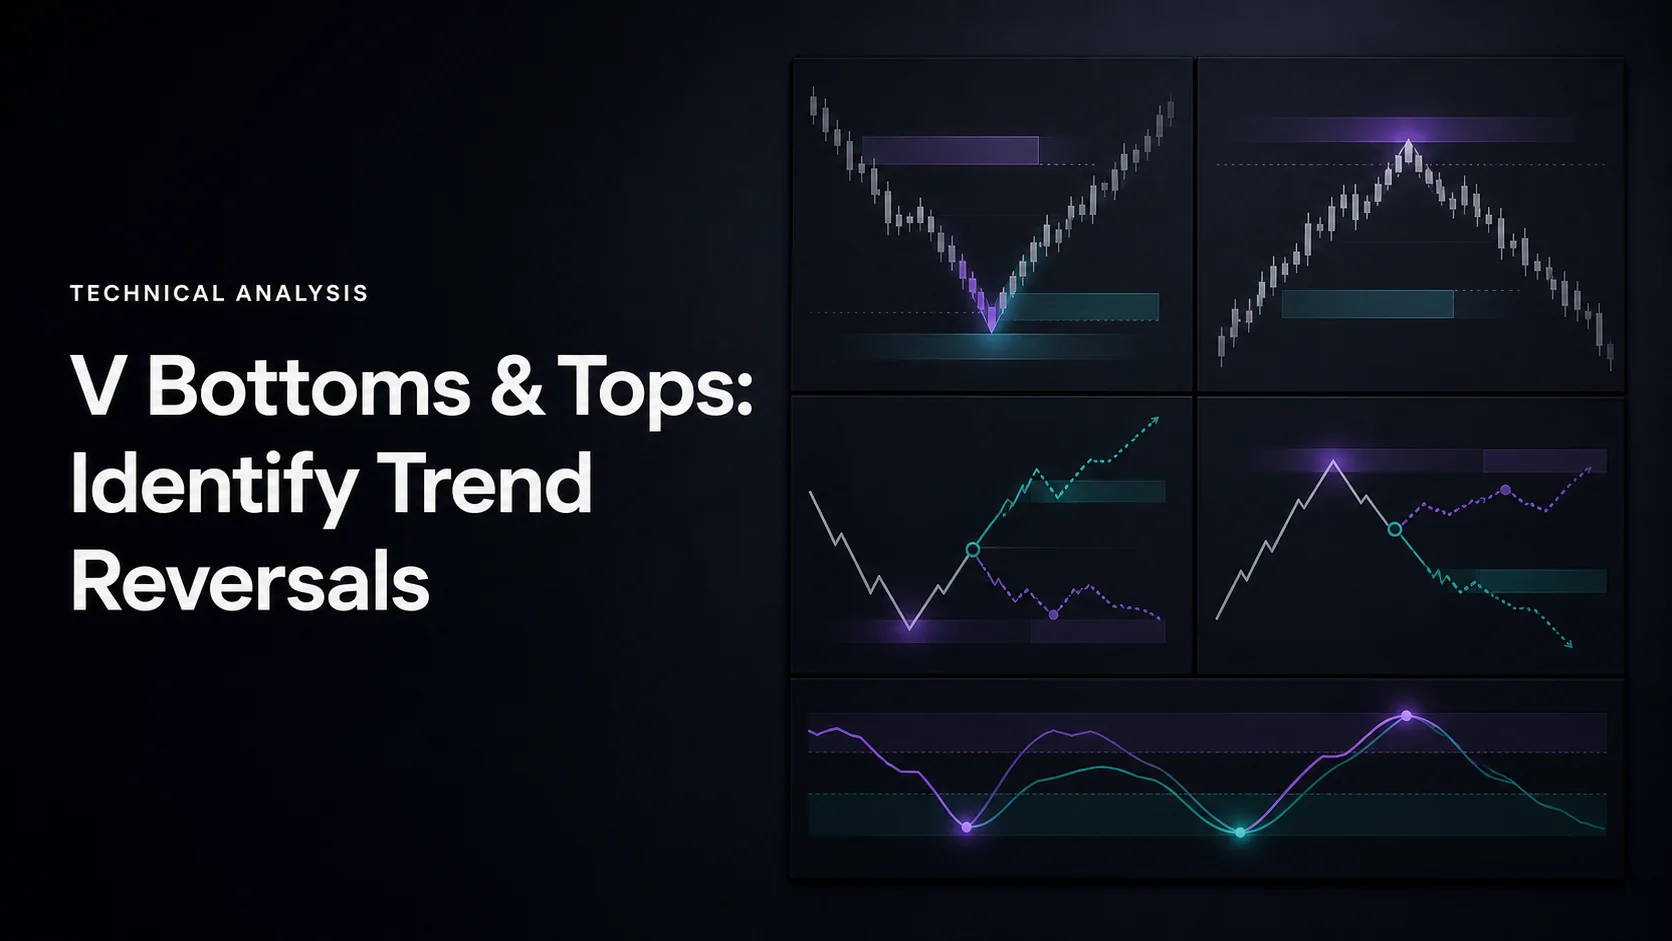
A V Bottom is a steep decline followed by a rapid recovery; a V Top is a sharp advance followed by a rapid decline. Both describe an abrupt change in direction. The challenge is recognizing enough of the second leg to confirm a reversal while a useful trading opportunity still remains.
LuxAlgo’s charting and AI platform supports that process with Quant Charts, native Library studies and Quant, our coding agent. Start with price structure and a defined confirmation rule. A dramatic candle or an early indicator marker alone does not establish a completed V pattern.
How to Spot V Bottom Patterns
Shape and Structure
Look for a fast downward leg with few pauses, followed by a substantial upward recovery. A long lower wick, an upward gap or a strong reversal candle can identify a candidate turning point. Price may still make a lower low after that candidate appears.
The two legs do not need perfect visual symmetry. A 45-degree angle changes when you resize the chart or switch scales. Compare percentage travel and the number of bars instead of expecting the recovery to mirror the decline’s screen angle.
Mark the start of the decline, its low and the level your rules require price to reclaim. Unlike a double bottom, a simple V does not inherently have two troughs and a neckline. A nearby horizontal resistance level or a break above a descending trendline can serve as an additional trigger if you define it in advance.
Technical Indicators
| Evidence | V Bottom interpretation | V Top interpretation |
|---|---|---|
| Price structure | A meaningful recovery from the low; potentially a reclaimed level and later higher low. | A meaningful decline from the high; potentially lost support and a later lower high. |
| Trendline break | A completed move above a descending trendline. | A completed move below an ascending trendline. |
| Volume | Compare the decline, turning area and recovery against a consistent baseline. | Compare the advance, turning area and decline; volume need not always fall at the top. |
| Momentum | Bullish RSI divergence may support a candidate but can be absent. | Bearish RSI divergence may support a candidate but can be absent. |
Several indicators can describe the same underlying price movement. Agreement is useful context, not a set of independent guarantees. A trendline drawn only after seeing the rebound can also make historical recognition appear easier than it was in real time.
Best Timeframes
Keep the hierarchy consistent. A swing trader might use weekly bars for context, daily bars for the pattern and four-hour bars for a predefined entry. An intraday study might instead use one-hour, fifteen-minute and five-minute bars. More charts do not automatically produce better signals.
A two- or three-day waiting period is a daily-chart heuristic, not a universal confirmation rule. On an intraday chart, define the required number of completed bars or a price threshold. Waiting reduces the chance of acting on an unfinished candle but can also leave less room to the target.
How to Spot V Top Patterns
Pattern Structure
A V Top begins with a forceful advance and then reverses downward. The peak can include an upper wick or reversal candle, but the defining feature is the subsequent decline. An overbought reading without that decline is not a completed V Top.
For a possible bearish trigger, draw the rising trendline using lows that were already observable, then specify whether a close below it is required. Alternatively, use a known horizontal support break or a chosen retracement of the upward leg. These are different entry definitions and will recognize the turn at different times.
Market Context
Review nearby resistance, the broader trend, scheduled announcements and comparable stocks or a sector benchmark. A company-specific event can produce a reversal that peers do not share. Conversely, several related stocks moving together can reflect one common exposure rather than several independent confirmations.
A sharp decline may be a temporary pullback within a larger uptrend. Specify the timeframe on which you are claiming a reversal. Neither a V-shaped drawing nor a momentum signal establishes that the longer-term trend has permanently changed.
Confirming Trend Reversals
Define Confirmation Before the Trade
Pattern definitions vary. Bulkowski’s V-bottom study uses a 38.2% recovery threshold and a particular sample definition; his V-top study describes the opposite structure. Those research definitions are not universal settings for every detector or timeframe.
For a hypothetical fall from $50 to $40, a 38.2% retracement is $43.82, an 80% retracement is $48 and a complete recovery is $50. These levels identify different stages. Reaching one does not guarantee reaching the next or imply that an entry received that exact fill.
Keep the original turning bar separate from the bar on which your confirmation condition becomes known. A backtest that enters at the low because a V label later appears there uses information unavailable at the time.
Volume Analysis
A volume spike can accompany either a reversal or continuation. Compare like-for-like observations: daily bars against daily history, or intraday activity against an appropriate intraday baseline. A threshold such as 1.5 times average volume is a parameter to test, not proof of a genuine reversal.
On-Balance Volume and the Accumulation/Distribution Line can help examine divergence, but they transform price and volume data rather than identify the buyers or sellers. Negative RSI divergence relates to potential tops; positive divergence relates to potential bottoms. A fast V can occur without a clean divergence of either kind.
Use Quant Charts data documentation to understand the selected feed. Exchange-specific equity volume is not consolidated market volume, and cryptocurrency volume belongs to the selected venue. Missing volume requires an explicit fallback rather than an assumed zero-volume confirmation.
For arithmetic only, a recovery from $100 to $112 is 12%, while a decline from $100 to $90 is 10%. Without dated charts, signal rules and execution records, these percentages cannot verify an AAPL or TSLA V-pattern trade. Performance from a separate “sushi roll” reversal strategy likewise cannot establish a V-pattern success rate.
Using LuxAlgo’s V Top / V Bottom Tool
The native V Top / V Bottom Library tool separates a climax candidate from a confirmed V. Its documented logic checks the incoming leg, evidence around the extreme and subsequent recovery. The V Top / V Bottom concept guide provides the broader pattern context.
The current defaults include a 20-bar leg window, a minimum four-bar duration, at least three ATR of travel and a minimum speed of 0.4 ATR per bar. ATR length is 14 and the accelerating-leg requirement is enabled. These are detector settings, not independently validated trading recommendations.
The default recovery requirement is 80% of the incoming leg within a time budget of 1.5 times that leg’s duration. Climax evidence can include volume and range conditions. Check the selected settings and available feed before interpreting the markers.
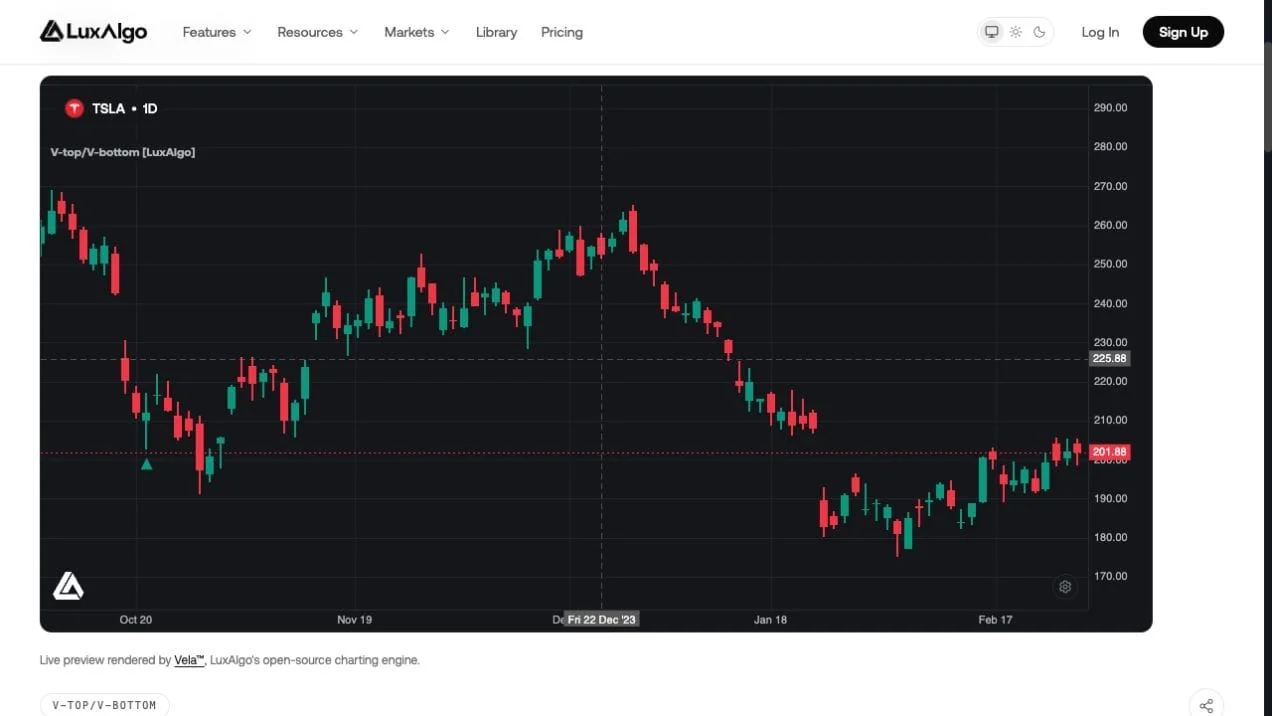
The climax marker appears on the tip bar, while the V confirmation requires the later recovery condition. Candidates can expire or become invalid; the tool also distinguishes a first pullback and invalidation. Review those events in sequence rather than assuming every historical marker was a tradable confirmation.
This is a native Library study for Quant Charts. Do not assume a TradingView toolkit or a similarly named script has identical calculations, defaults or signal timing. For testing, specify the actual implementation and which event creates an order.
Multiple Timeframe Analysis
A practical swing workflow can combine a 12-week SMA, a 10-day SMA and a four-hour momentum study:
- Weekly context: define whether the completed weekly close is above the 12-week SMA and whether that average is rising.
- Daily setup: identify the downward leg, recovery threshold and a pre-existing resistance level. A close above the 10-day SMA is a separate condition, not confirmation by itself.
- Four-hour execution: use a defined entry trigger. If adding Know Sure Thing (KST), record its parameters and the required crossover rather than choosing it after observing the rebound.
This is a hypothetical research sequence, not a verified BBWI trade or a promised 27% gain. A move from $100 to $127 would equal 27%, but the strategy’s return depends on when it actually entered and exited, its exposure and costs.
Trading V Patterns
Entry and Exit Rules
| Pattern | Possible entry rule | Invalidation and target planning |
|---|---|---|
| V Bottom | Completed recovery threshold or predefined descending-trendline break. | Define the protective level below relevant structure; assess overhead resistance before entry. |
| V Top | Completed decline threshold or predefined rising-trendline break. | Define the protective level above relevant structure; assess underlying support and short-sale constraints. |
| Extended V | A pause interrupts the return leg; require a separately defined consolidation breakout. | Use the actual consolidation structure. A flag or pennant is possible, not automatic. |
Do not mix an early trendline entry with the reported results of a later recovery entry. A retest may offer a different stop distance, but it can fail or never occur. If price has already covered most of the distance to your target, skipping the setup is a valid outcome.
Risk Controls and Correct Reward-to-Risk Math
Consider a hypothetical fall from $50 to $40, followed by entry at $51, a stop at $39 and a $60 target. Risk is $12 per share and potential reward is $9: reward-to-risk is 0.75:1, not 2:1. With that entry and stop, a 2R target would be $75. Do not move the target there merely to make the ratio look better.
A different hypothetical setup could enter at $51 after a supported higher low, use a $48 stop and target $57. That is $3 of planned risk and $6 of potential reward, or 2R. The tighter stop must fit the observed structure; it cannot be justified solely by the desired ratio.
For a $20,000 account and an illustrative 0.75% risk budget, planned risk is $150. At $3 per share, that permits 50 shares before costs. A gap fill at $47 produces a $200 loss before costs, exceeding the plan. Stops control an exit instruction, not a guaranteed execution price.
A chosen 1% budget would produce a different position size. Neither percentage is universal. Consider correlated positions, liquidity, event gaps, commissions and—for shorts—borrow availability and costs. A 2R target alone does not establish positive expectancy.
Test V-Pattern Rules with Quant
Use Quant, our coding agent, to turn one clearly defined idea into inspectable code. For example:
Create a long-only V-bottom research strategy on standard daily candles. Define a candidate downward leg using explicit lookback, duration and ATR-travel inputs. Confirm only after a completed close recovers 80% of that leg within the specified bar budget. Enter at the next open, never at the earlier extreme. Invalidate candidates that make a new low or expire. Allow one position, freeze the initial protective level below the candidate low and test a 2R exit with realistic costs.
This is a specification to refine, not a claim that it reproduces the Library detector. Inspect the generated code and run it manually as described in Making Strategies with Quant. Check candidate replacement, confirmation timing, expiry, next-open fills and what happens if price gaps past the stop.
Use the native strategy viewer to inspect trades and execution assumptions. Compare the same rule across held-out periods, and count failed and expired candidates as well as completed patterns. Report drawdown, net expectancy, exposure and sample size alongside win rate.
Implementation Checklist
| Stage | Record before proceeding |
|---|---|
| Identify | Instrument, feed, session, interval, leg endpoints and candidate timestamp. |
| Confirm | Exact recovery or breakout condition and the first bar on which it became known. |
| Plan | Entry assumption, structural stop, realistic target, size and transaction costs. |
| Review | Actual fills, failures, expired candidates and whether the rules changed after the fact. |
How To Tell When A Trend Will Reverse
The tutorial below provides additional context on distinguishing a pullback from a reversal. Treat it as supplemental education; use the explicit V-pattern and risk rules above for your own tests.
Frequently Asked Questions
What is a V Bottom in trading?
A steep decline followed by a rapid recovery. The completed shape requires subsequent price movement; a single reversal candle is only a candidate.
How is a V Top different from a pullback?
A V Top describes a sharp advance followed by a substantial decline on the chosen timeframe. Whether that changes the broader trend requires separate context and rules.
Must the two sides of a V be symmetrical?
No. Chart angles depend on scale. Compare price travel and elapsed bars rather than requiring mirrored screen angles.
Is a LuxAlgo climax marker a confirmed V signal?
No. The native tool separates the early climax candidate from later recovery confirmation. Candidates can become invalid or expire.
Does an entry at $51, stop at $39 and target at $60 offer 2R?
No. The planned risk is $12 and potential reward is $9 per share, giving 0.75R. A 2R target with that entry and stop would be $75.
Should I wait two or three days after every trendline break?
No. That is a daily-chart heuristic, not a universal rule. Define the confirmation threshold and completed-bar timing for the timeframe being tested.
References
LuxAlgo Resources
- V Top / V Bottom Native Library Tool
- V Top / V Bottom Concept Guide
- LuxAlgo Quant
- Making Strategies with Quant
- Native Strategy Backtests
- Quant Charts Data Coverage
External Resources
Read next