Visible Average Price: Average Price of Bars Explained
The Visible Average Price is a TradingView built-in indicator that draws one horizontal line: the simple average of a chosen price source across the bars currently on your screen. Scroll or zoom and the set of visible bars changes, so the line is recalculated. That makes it a fast way to see the equal-weighted mean of whatever window you are looking at, and it also makes it a property of your chart view rather than of the market: two traders looking at the same instrument with different zoom levels see two different lines. Understanding that distinction is most of what there is to know about the tool.
Key features:
- Averages a single selectable source (close by default, or any other price series) across the visible bars only.
- Recalculates whenever the visible range changes, so the line updates as you pan or zoom.
- Draws one flat line, optionally with a price label, in a chosen color and thickness.
What it is good for:
- Reading where price sits relative to the mean of the period you have framed on screen.
- Quick comparisons of a session or a swing against its own average without setting a lookback length.
- A reference for how far a move has stretched from the middle of the window you are studying.
Limitations:
- The value depends on the zoom level, so it cannot be shared, alerted on or backtested as a stable rule.
- It ignores everything off screen, including the levels that matter most on longer horizons.
- It weights every bar equally and ignores volume, so it is not a measure of where business was done.
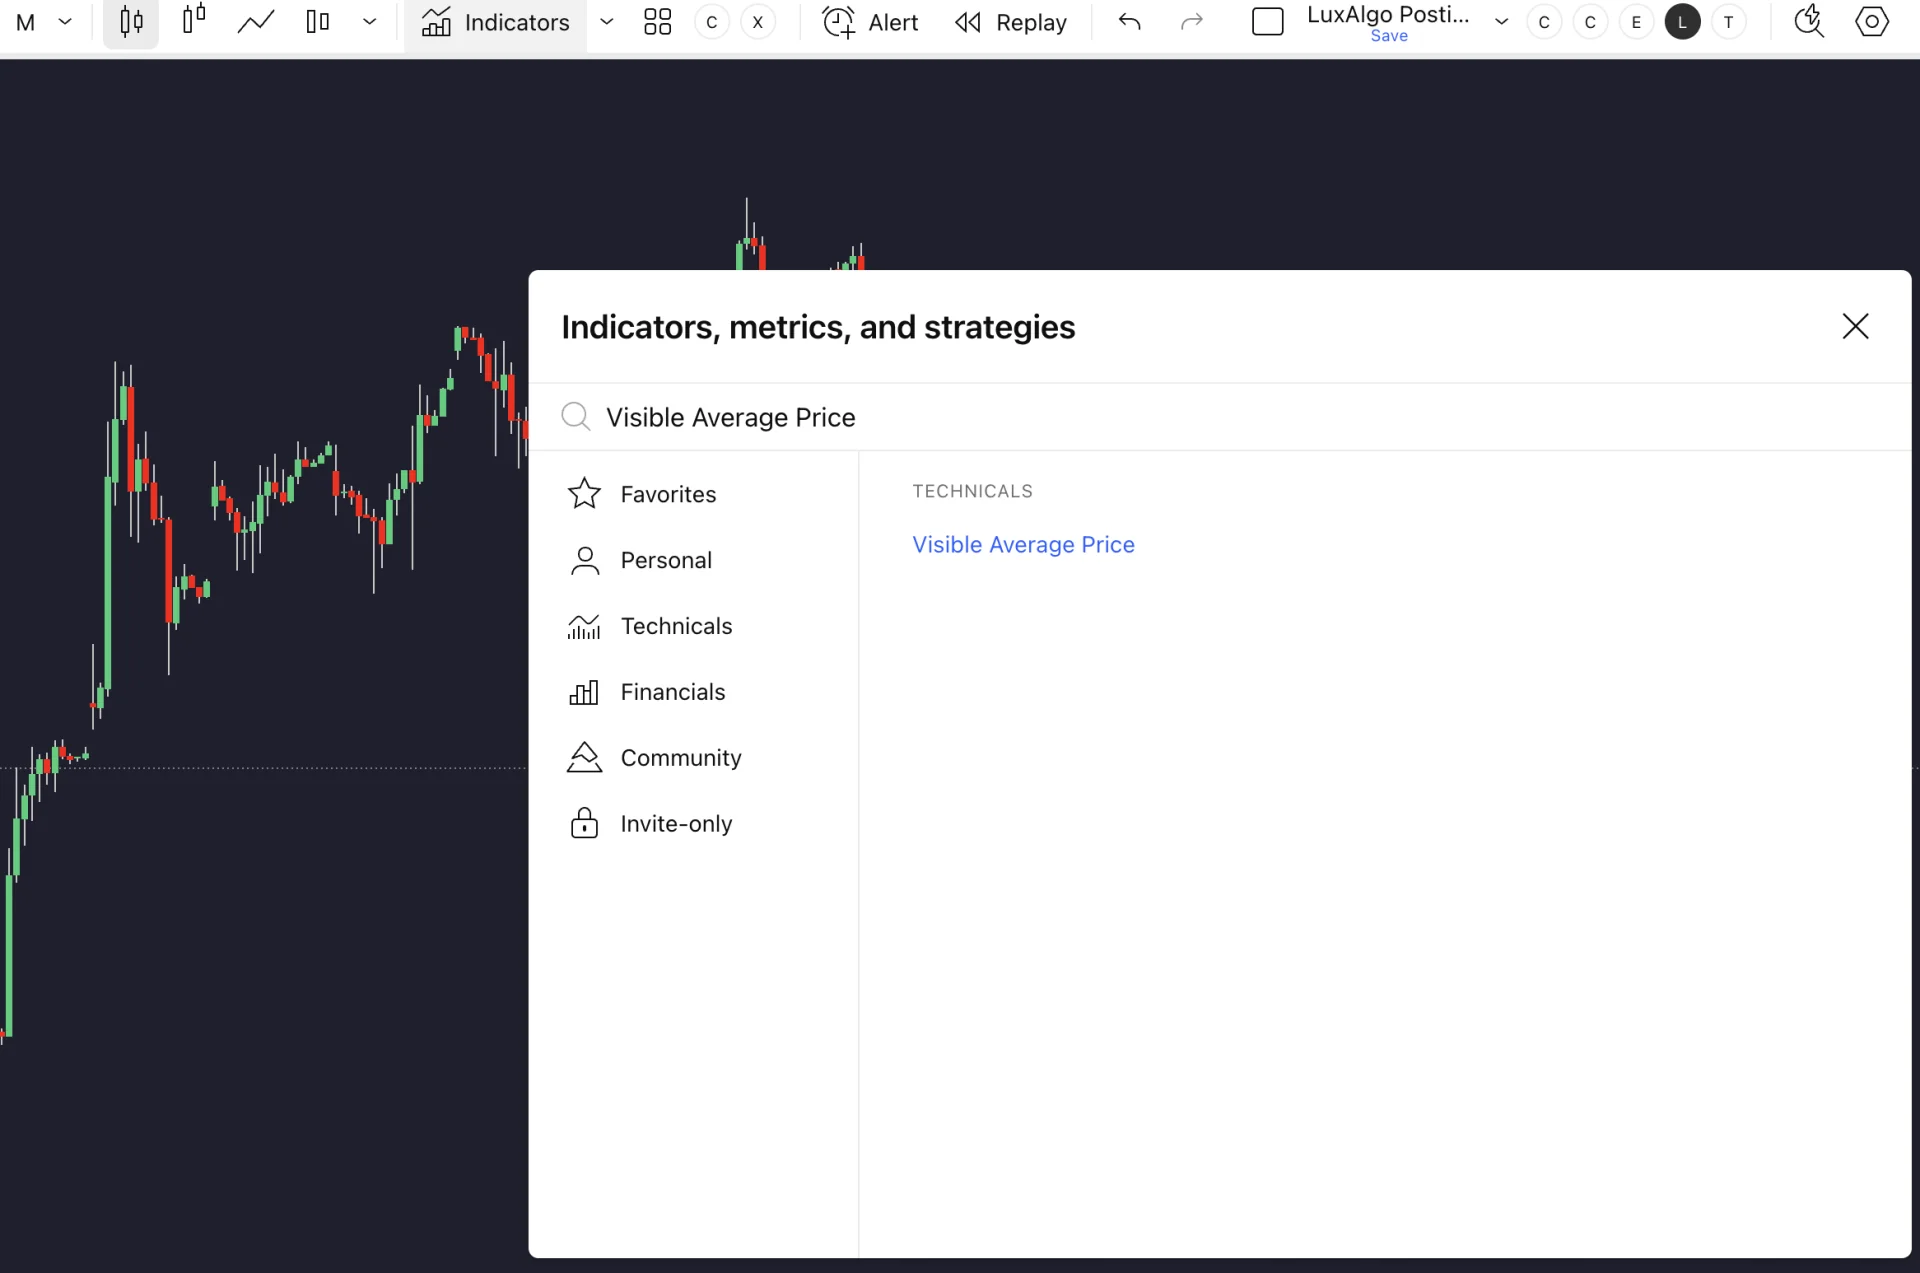
The indicator itself lives on TradingView. On Quant Charts the same idea is available in stable, testable forms: the native Moving Average for a fixed window, the Anchored VWAP for an average that starts at a bar you choose, and two native visible-range tools for zones and distributions. Quant, our coding agent, can also build an anchored simple average from a written rule that you can inspect in Code and test with Run.
A Related Visible-Range Tool: Volume Profile Visible Range
TradingView published this tutorial in October 2024. It covers the Visible Range Volume Profile, a different built-in that also recalculates from the bars on screen but distributes volume by price rather than averaging price. It is included here because the two tools share the same visible-range logic and the same dependence on your zoom level.
How the Visible Average Price Indicator Works
There is no lookback length to set. The window is whatever the chart shows, and the calculation is an ordinary arithmetic mean over it.
Calculation Process
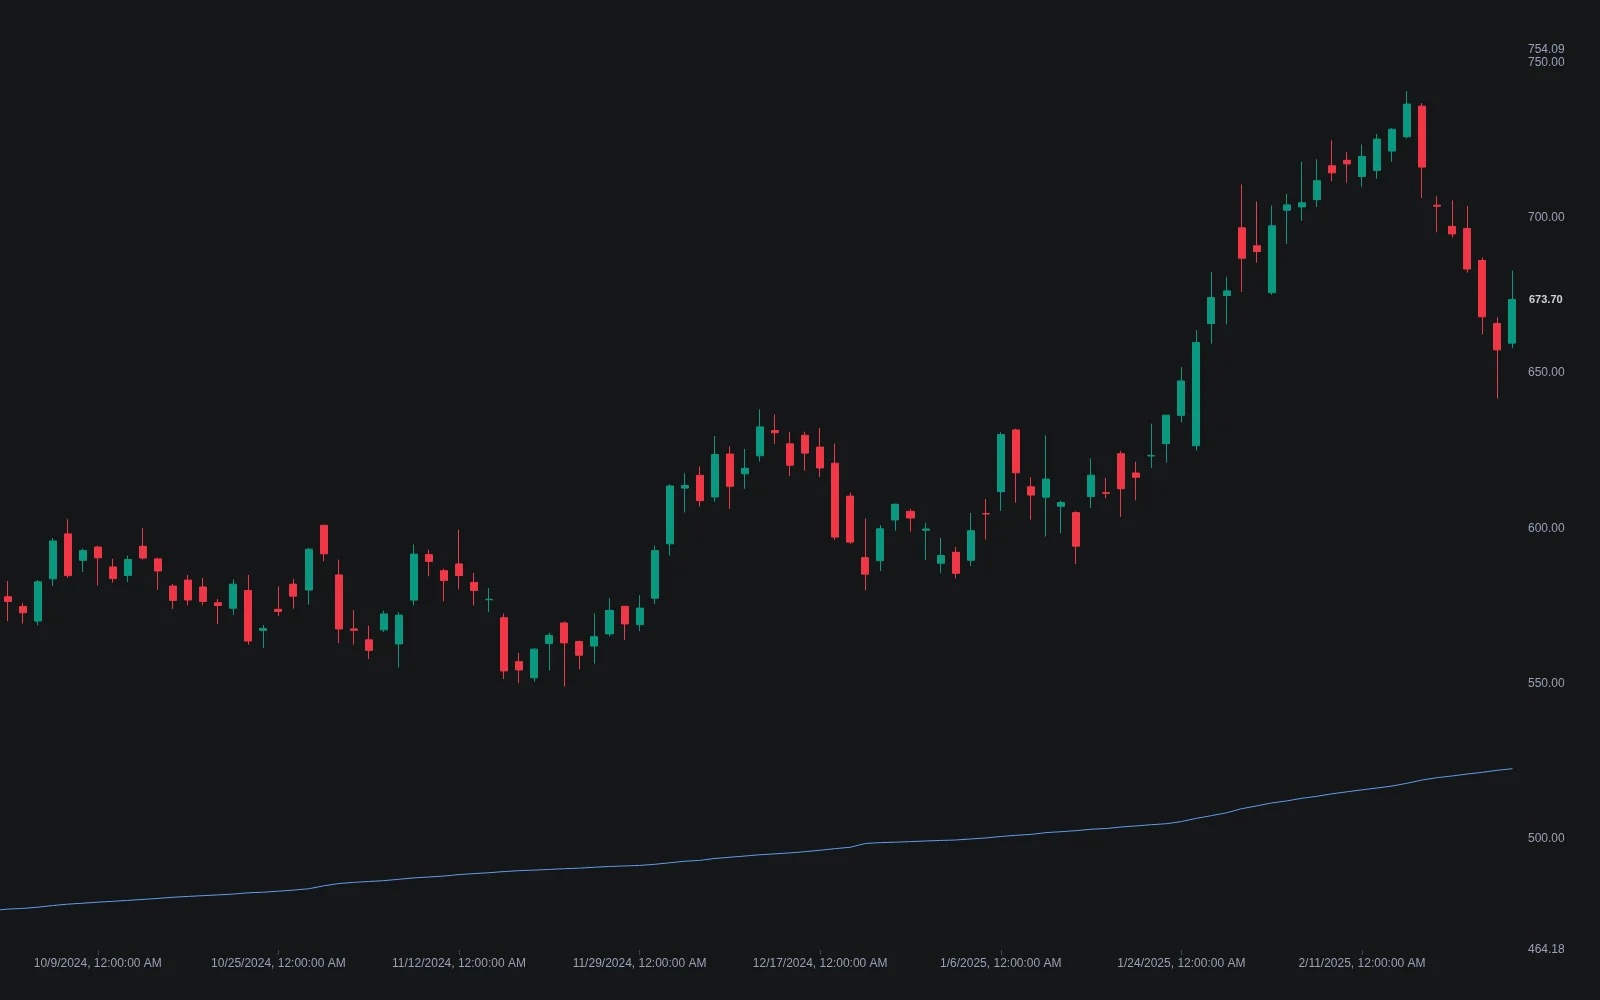
Take the chosen source value for every visible bar, add them up and divide by the number of visible bars. The result is drawn as a horizontal line across the visible range. If you scroll so that older bars enter the view and recent bars leave it, or zoom so that more or fewer bars fit, the sum and the count both change and the line moves. In other words, the Visible Average Price is a simple moving average whose length is always equal to the number of bars on screen and whose value is only reported once, at the right edge, rather than plotted bar by bar.
The hypothetical table shows the same market viewed at three zoom levels. Nothing about the market changes between rows; only the window does.
| Visible bars (daily chart) | Window covered | Visible average of closes (hypothetical) | Last close $103.20 relative to the line |
|---|---|---|---|
| 20 | About four trading weeks | $101.30 | 1.9% above |
| 50 | About ten weeks | $99.80 | 3.4% above |
| 120 | About six months | $97.40 | 6.0% above |
| 250 | About a year | $104.60 | 1.3% below |
The last row is the point: with a year on screen the same close sits below the average, because a higher-priced period earlier in the year has entered the window. Any reading of the line has to be qualified with the window that produced it.
Setup Requirements
The indicator is a TradingView built-in, added from the indicators list; nothing is downloaded or installed. It is not a LuxAlgo indicator and has no direct equivalent in the LuxAlgo Library, for the reason discussed below: a value that depends on the viewer's zoom cannot be alerted on or backtested, which is what Library tools are built for.
Configuration Options
- Source: the price series to average. Close is the usual choice; typical price (high, low and close divided by three) or the bar midpoint smooth the effect of gaps and wicks.
- Style: the visibility of the average line and of a price label showing its current value, plus the line's color and thickness.
That is the whole settings dialog. There is no length, no smoothing type and no anchor, which is both the tool's appeal and its limit.
Using the Indicator in Technical Analysis
Every use of the Visible Average Price is a use of "price relative to the mean of the window I have framed". The framing is a decision you make with the scroll wheel, so make it deliberately: decide which period you want the average of, fit exactly that period on screen, and then read the line.
Reading Price Against the Window's Mean
Price above the visible average means the current bar is above the equal-weighted mean of the period on screen; below means the reverse. That is a description of position, not a momentum signal. A market that trended up for the whole window will have most of its recent bars above the line simply because the line includes the lower early bars, and the same market seen at a wider zoom may read the opposite way. Treat the line as a location reference, and take direction from a tool that measures it, such as the slope of a fixed-length average.
One framing is genuinely useful: fit exactly the current session on screen. The visible average is then the session's equal-weighted mean price so far, a volume-blind cousin of the session VWAP. Where price sits relative to that line after the first hour says whether the session has, on average, been bought or sold from the open. The VWAP answers the same question weighted by where the volume actually traded, which is why most intraday traders prefer it.
A Mean Is Not a Level
It is tempting to read the visible average as dynamic support or resistance. Two things argue against it. First, nobody else is watching your line: its value depends on your zoom, so it is not a shared reference the way a 200-day average or a session VWAP is, and levels work partly because many participants act around them. Second, mean reversion toward the middle of a range is a property of ranges, not of the line; in a trend the mean keeps moving away from price. If you want to test the idea, fix the window so the line is reproducible, then compare reactions at the line with reactions at a genuine support and resistance zone on the same data.
Timing Entries and Exits
Within a chosen window, a pullback to the visible average in an uptrend is a candidate for a trend-continuation entry, and repeated failures to hold above the line are a warning that the window's character is changing. Both are hypotheses about the specific window you framed. Before acting on them, write the rule down with a fixed window, so it means the same thing tomorrow, and test it. The stop and the target should come from structure, the prior swing low and the next zone, not from the average.
Pros and Cons of the Visible Average Price Indicator
Benefits Over Moving Averages
The tool needs no parameters. You never choose a length, because the window is the chart, and you never wonder whether 20 or 50 is the right number for the period you care about. For a quick read of a session, a swing or an earnings reaction, framing the period and glancing at the line is faster than configuring an average. Because it reports one value rather than a plotted curve, it is also uncluttered: a single reference line instead of another wiggle across the chart.
Drawbacks and Considerations
The same property is the drawback. The value is not reproducible: change the zoom and the line moves, so it cannot be shared with another trader, written into an alert or included in a backtest. It ignores everything off screen, which on any horizon longer than the window means it ignores the levels most participants watch. It weights every bar equally and ignores volume, so a thin overnight bar counts as much as the busiest hour of the day. And with only a few bars on screen, one large bar moves the line substantially, so intraday readings on a tight zoom are noisy. Anchored and fixed-window averages exist to solve exactly these problems.
Comparison: Visible Average Price, Moving Averages and VWAP
| Tool | Window | Weighting | Reproducible and testable | Native on Quant Charts |
|---|---|---|---|---|
| Visible Average Price | Whatever is on screen | Equal | No; depends on the viewer's zoom | No (TradingView built-in) |
| Simple moving average | Fixed length, rolling | Equal | Yes | Moving Average (SMA default, Length 20) |
| Anchored simple average | From a chosen bar to now | Equal | Yes, given the anchor | Buildable with Quant |
| Session VWAP | From the session open, resets daily | Volume | Yes | VWAP (Session, Week or Month anchor) |
| Anchored VWAP | From a chosen bar to now | Volume | Yes, given the anchor | Anchored VWAP (anchor time, optional bands) |
The choice comes down to what the average is for. For a quick visual read, the Visible Average Price is fine. For anything that has to be repeated, alerted on or tested, use a fixed-window or anchored average, and if the question is where business was actually done, use a volume-weighted one.
Stable Alternatives on Quant Charts
Each native tool below fixes the window in a way that survives scrolling, which is what turns an on-screen mean into something you can alert on and test.
| Tool | What it averages or profiles | Key inputs |
|---|---|---|
| Moving Average | A rolling fixed-length average of a source; 13 types including SMA and EMA, with an optional second average and cross alerts | Type (SMA default), Length 20, Source close; MA 2 Length 50 |
| Anchored VWAP | Volume-weighted average price from a chosen bar to now, with optional standard-deviation bands and cross alerts | Anchor time, Source hlc3, Bands, Multiplier 2.0 |
| VWAP | Volume-weighted average that resets each session, week or month, with bands and cross alerts | Anchor Period Session, Source hlc3, band multipliers 1, 2, 3 |
| Supply and Demand Visible Range | Volume across the visible range binned by price into supply and demand zones, with plain and volume-weighted averages inside each zone; refreshes on scroll | Threshold %, Resolution, Intra-bar TF |
| Visible Range Mean Deviation Histogram | Bins of visible prices centred on the visible mean and scaled by standard deviation, with Point of Control lines | Bins Per Side, Deviation Multiplier, Show POCs |
Two Native Visible-Range Tools
Two Library tools embrace the visible-range idea deliberately, as an interactive lens rather than a fixed level map. Supply and Demand Visible Range bins the volume traded across the bars on screen and builds supply and demand zones from the top and bottom of the range, drawing the average and the volume-weighted average inside each zone. The Visible Range Mean Deviation Histogram centres a ladder of bins on the mean of the visible prices, the same quantity the Visible Average Price reports, then sizes each bin by standard deviation and marks the most populated ones as Points of Control. Both recalculate when you scroll, which their pages state plainly, and both open on Quant Charts from their Library pages.
Building an Anchored Average with Quant
If what you want is the Visible Average Price without the zoom dependence, describe it to Quant: the simple average of closes from a chosen anchor bar to the current bar, drawn as a line, with an alert when price crosses it. That is a few lines of code, and the anchor makes the value reproducible. From there, a rule can be written and tested: for example, in a market above its anchored average from the last major swing low, buy a close back above the line after a dip below it, with the stop below that dip's low and the target at the next zone. Inspect the Code to confirm the anchor and the closed-bar evaluation, then click Run. The Making Strategies with Quant guide shows the workflow, and the native backtest guide explains the Backtest Summary: net profit, trade count, win rate, maximum drawdown and profit factor, with commission and slippage set in the strategy properties.
Compare the anchored rule against the same rule on a fixed-length average and on the Anchored VWAP from the same bar, on identical data and costs, and read trade count before return. The Library's market-structure tools draw their labels from their own logic and do not read any average line; agreement between them and a cross of the average is confluence to test rather than confirmation.
Conclusion
The Visible Average Price does one small thing well: it tells you the equal-weighted mean of the bars you have chosen to look at, instantly and without settings. Its weakness is the same fact seen from the other side. The line belongs to your screen, not to the market, so it cannot be shared, alerted on or tested, and it says nothing about the levels off screen or about where volume traded.
When the question is quick and visual, frame the period and read the line. When the question has to be answered the same way tomorrow, fix the window: a native Moving Average for a rolling lookback, an Anchored VWAP or an anchored simple average built with Quant for an event-based one, and the native visible-range tools when the on-screen lens is exactly what you want. Then test the rule before trading it.
FAQs
Why does the Visible Average Price line move when I scroll?
Because the calculation uses only the bars currently on screen. Scrolling or zooming changes which bars are visible, so the sum and the count change and the line is redrawn. That is the indicator working as designed, and it is also why the value cannot be shared or backtested.
How is the Visible Average Price different from a moving average?
A simple moving average uses a fixed number of bars and is recomputed on every bar, giving a curve that means the same thing on every screen. The Visible Average Price uses however many bars are visible and reports a single flat value at the right edge. It is an SMA whose length is set by your zoom rather than by you.
Is the Visible Average Price the same as VWAP?
No. VWAP weights each bar's price by its volume and resets at the session open, so it measures where business was done. The Visible Average Price weights every visible bar equally and ignores volume. With exactly one session on screen the two answer a similar question, but VWAP does so with volume and in a reproducible way.
Can the Visible Average Price act as support or resistance?
Not reliably. Levels work partly because many participants watch the same price, and the visible average depends on each viewer's zoom, so nobody else sees your line. Reactions near it in a range reflect the range, not the line. Test the idea only with a fixed window, against genuine support and resistance zones on the same data.
Is there a Visible Average Price indicator on Quant Charts?
Not under that name, because a zoom-dependent value cannot be alerted on or tested. The native Moving Average, VWAP and Anchored VWAP provide fixed and anchored averages, Supply and Demand Visible Range and the Visible Range Mean Deviation Histogram use the visible range deliberately, and Quant can build an anchored simple average from a written rule.
What source should I use for the average?
Close is the usual choice and aligns with most other tools. Typical price, the average of high, low and close, or the bar midpoint smooth the effect of wicks and gaps. Whichever you choose, record it along with the window when you note a reading, because both change the value.
References
LuxAlgo Resources
- Quant Charts
- LuxAlgo Quant
- Moving Average Indicator
- Anchored VWAP Indicator
- VWAP Indicator
- Supply and Demand Visible Range
- Visible Range Mean Deviation Histogram
- Simple Moving Average
- Session VWAP
- Anchored VWAP Concept
- Dynamic Support and Resistance via Moving Averages
- S/R Zone
- Supply and Demand Zones
- Volume Profile
- Making Strategies with Quant
- Native Backtest Guide
- Understanding Moving Averages
External Resources
Read next