Wedge Pattern - Setups for Timely Breakouts
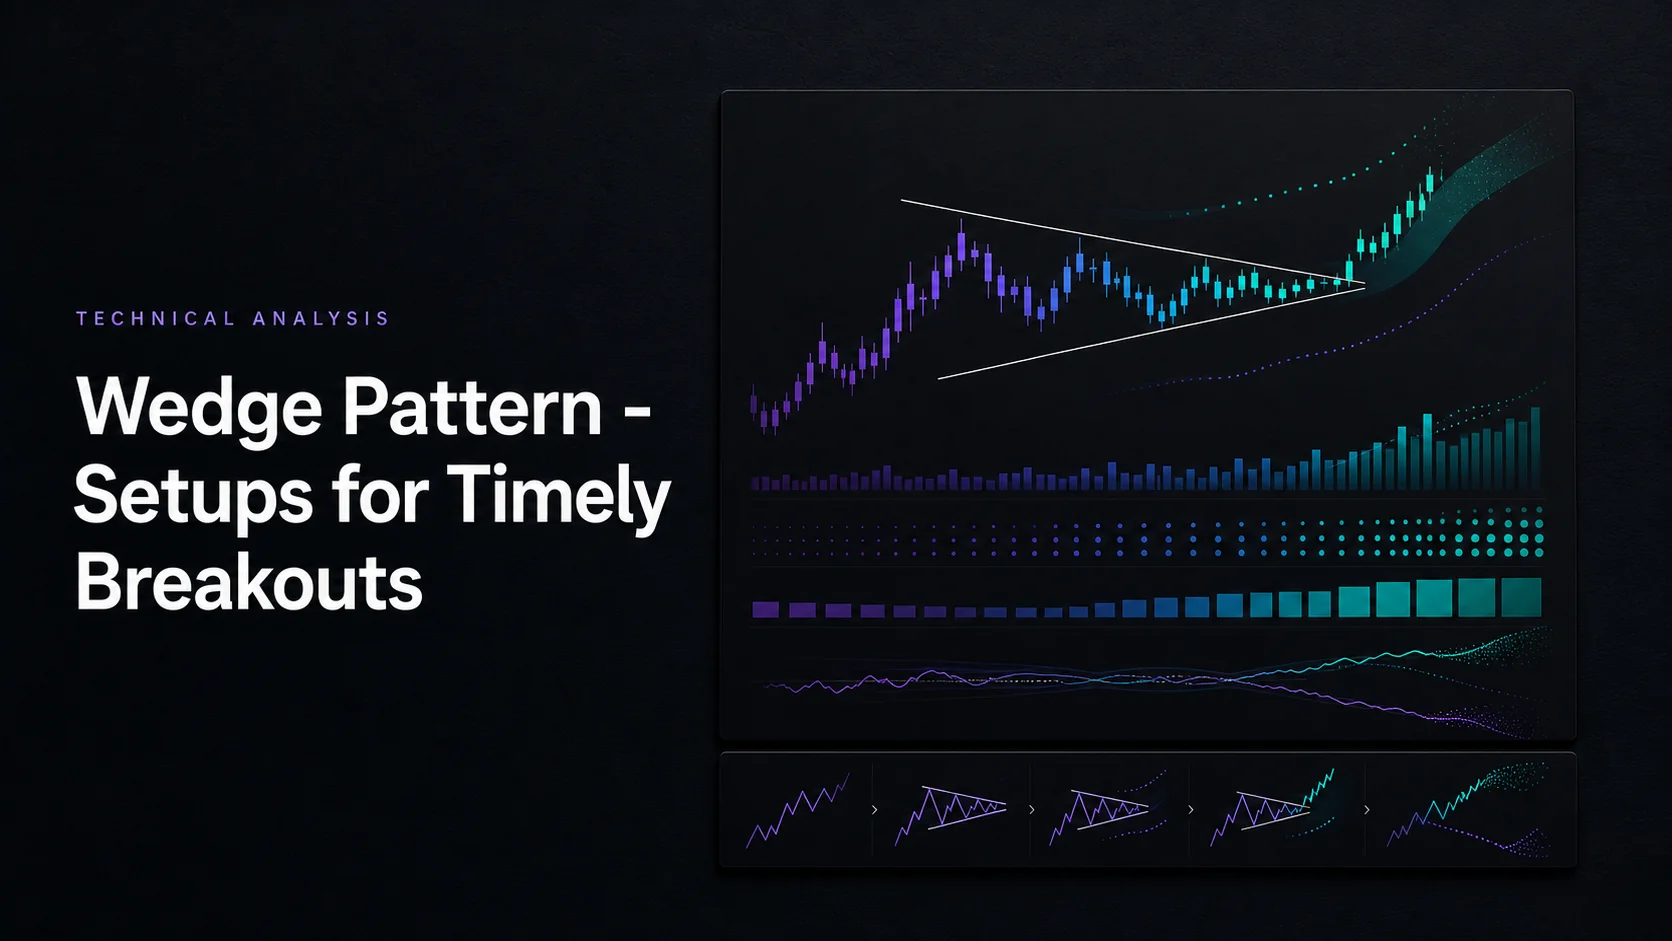
Wedge patterns organize a narrowing sequence of price swings into a potential breakout setup. A rising wedge slopes upward and is commonly studied for a bearish break; a falling wedge slopes downward and is commonly studied for a bullish break. Neither shape guarantees the direction or size of the next move.
This guide explains wedge geometry, confirmation choices, entries and risk management. LuxAlgo’s charting and AI platform helps connect the visual setup to a repeatable process: review the formation on Quant Charts, then use Quant, our coding agent, to help implement and test explicit rules.
Two Main Types of Wedge Patterns
Rising Wedges
A rising wedge has higher highs and higher lows between two upward-sloping boundaries. The lower support line rises faster than the upper resistance line, so the distance between them narrows. A break below support is the conventional bearish trigger.
Following a larger advance, this can become a reversal candidate. During a rally inside a broader downtrend, it can instead be a bearish continuation candidate. Define the preceding trend and breakout rule before deciding which interpretation applies.
Falling Wedges
A falling wedge has lower highs and lower lows between two downward-sloping boundaries. Resistance falls faster than support, creating convergence. A break above resistance is the conventional bullish trigger.
After a decline, the formation can suggest a reversal; during a pullback inside an uptrend, it can suggest continuation. Falling wedges are not universally more reliable than rising wedges. Their usefulness depends on the rules, market, timeframe and costs.
Wedges, Channels and Triangles
| Structure | Boundaries | Interpretation to investigate |
|---|---|---|
| Rising wedge | Both rise; support is steeper | Bearish reversal or continuation after a downward break |
| Falling wedge | Both fall; resistance is steeper | Bullish reversal or continuation after an upward break |
| Channel | Roughly parallel | Does not show wedge-style convergence |
| Symmetrical triangle | Upper boundary falls while lower boundary rises | Compression with different geometry |
| Broadening formation | Boundaries move apart | Expansion rather than narrowing |
The StockCharts rising-wedge guide and falling-wedge guide explain the traditional structures. Their longer-term chart examples are reference cases, not requirements that every wedge last several months.
Finding and Confirming Wedge Patterns
Drawing Support and Resistance Lines
Connect meaningful swing highs for the upper boundary and swing lows for the lower boundary. Use a consistent basis, such as wick extremes, rather than switching to candle bodies wherever that makes the pattern fit. Keep the chart scale consistent too.
Two points can define a straight boundary, while additional touches help assess whether price has respected it. Specify a minimum for your method. A requirement for three touches on each line is different from five alternating touches across both lines; neither should be silently substituted for the other.
Record how swings become confirmed. A pivot detected only after later bars must not be treated as known at the original turning point in a backtest. Avoid redrawing boundaries after a failed break solely to preserve a winning-looking wedge.
Volume and Time Analysis
Declining volume during formation and expanding activity at the break are traditional supporting observations. A surge is not proof that the breakout will hold, and low volume alone does not prove it is false. Define a filter, such as volume relative to a stated prior average, and test its contribution.
Volume over time and a volume profile are different measurements. The former compares activity between candles; the latter groups volume by price. A claim that a “volume profile should decline during formation” confuses those two views.
Check the symbol’s feed and session. Forex tick volume, exchange-specific equity volume and consolidated volume are not interchangeable. Pattern duration should also be defined in the context of the chart interval: several weeks on a daily chart is different from several dozen intraday bars.
Spotting False Signals
A false-break rule might identify price crossing a boundary and then closing back inside within a specified number of bars. Set that window before evaluating examples. A strong-looking candle can still fail after its close.
- Distinguish an intrabar touch from a completed close beyond the line.
- Check whether the boundaries truly converge and use consistent swing criteria.
- Record breaks in the unexpected direction rather than discarding them.
- Separate a countertrend reversal from a continuation setup.
- Include gaps, nearby opposing levels and upcoming session changes in the plan.
Greater compression does not guarantee a larger or more successful breakout. A market can drift beyond a trendline without developing the expected follow-through.
Trading Wedge Breakouts
Entry and Exit Points
| Model | Candidate entry | Trade-off |
|---|---|---|
| Falling-wedge breakout | A completed close above resistance | Earlier participation, with risk of a return inside |
| Falling-wedge retest | A pullback that holds the broken boundary under a defined rule | Different entry and stop distance; the retest may never happen |
| Rising-wedge breakdown | A completed close below support | Potentially late entry after a large breakdown candle |
| Rising-wedge retest | A recovery that fails near former support | The line may fail to hold as resistance |
A retest entry is an alternative, not mandatory confirmation or an automatic improvement. State how close price must come to the boundary, what candle completes the trigger and when the setup expires. Using only successful historical retests creates selection bias.
Targets can reference the pattern origin, a prior swing or a measured height projection. These are different exit models. Identify nearby support or resistance before assuming there is room for the entire projection, and measure reward from the actual entry price.
Stop-Loss Rules
For a bullish setup, a stop below the retest low tests a narrower hypothesis than a stop below the whole formation. For a bearish setup, the corresponding references are above the retest high or formation high. The chosen distance affects both position size and how often normal variation stops the trade.
If a pin bar supplies the retest trigger, its extreme can be one reference, with a defined buffer. Do not place a stop just beyond the broken line solely to create an attractive ratio. A protective order can fill worse than expected during a gap or fast market.
Worked Risk Example
Suppose a hypothetical falling-wedge setup produces a $50 entry, a $48 initial stop and a $54 target. Risk is $2 per share and potential reward is $4, or 2R before costs. The target is a planned exit, not a promised gain.
A $20,000 account using an illustrative 0.5% cash-risk budget allocates $100. At $2 per share, that allows 50 shares, worth $2,500. A stop fill at $48 loses $100 before costs, while a gap exit at $47 loses $150. The example percentage is not a universal recommendation.
If entry slips to $51 while the same stop and target remain, risk becomes $3 and reward $3: only 1R. Recalculate size and assess the remaining opportunity rather than retaining the original position because the chart still resembles a wedge.
A trailing rule can change the exit as price develops, but it also changes the outcome distribution. An indicator’s trailing line is not a broker order and cannot guarantee that profits are locked in. Test the rule with realistic execution and include losing trades.
Reviewing Market Examples
For a VFH study covering October 2022 through March 2023, verify the individual swing dates, adjusted prices, volume feed and first actionable break. Selected highs and lows alone cannot establish that a trade was available or profitable. Keep the source data with the chart annotations.
As a hypothetical EUR/USD example, a rising wedge after an advance could produce a short candidate when support breaks and a later retest fails. Define the retest and stop before evaluating the result. A ten-month formation or an attractive screenshot does not by itself establish an ideal entry.
Using LuxAlgo for Wedge Trading
Compare Intervals on Quant Charts
Use Quant Charts to inspect the swings and compare the setup with its broader trend. Changing the interval changes the candle aggregation and potentially the wedge itself. Save the interval, session and boundary choices used in the test.
Pattern Tools
The Library’s pattern tools on a Quant Chart include automatic detection for wedges and other formations. A detected label is a starting point for inspection, not evidence that a subsequent breakout will succeed.
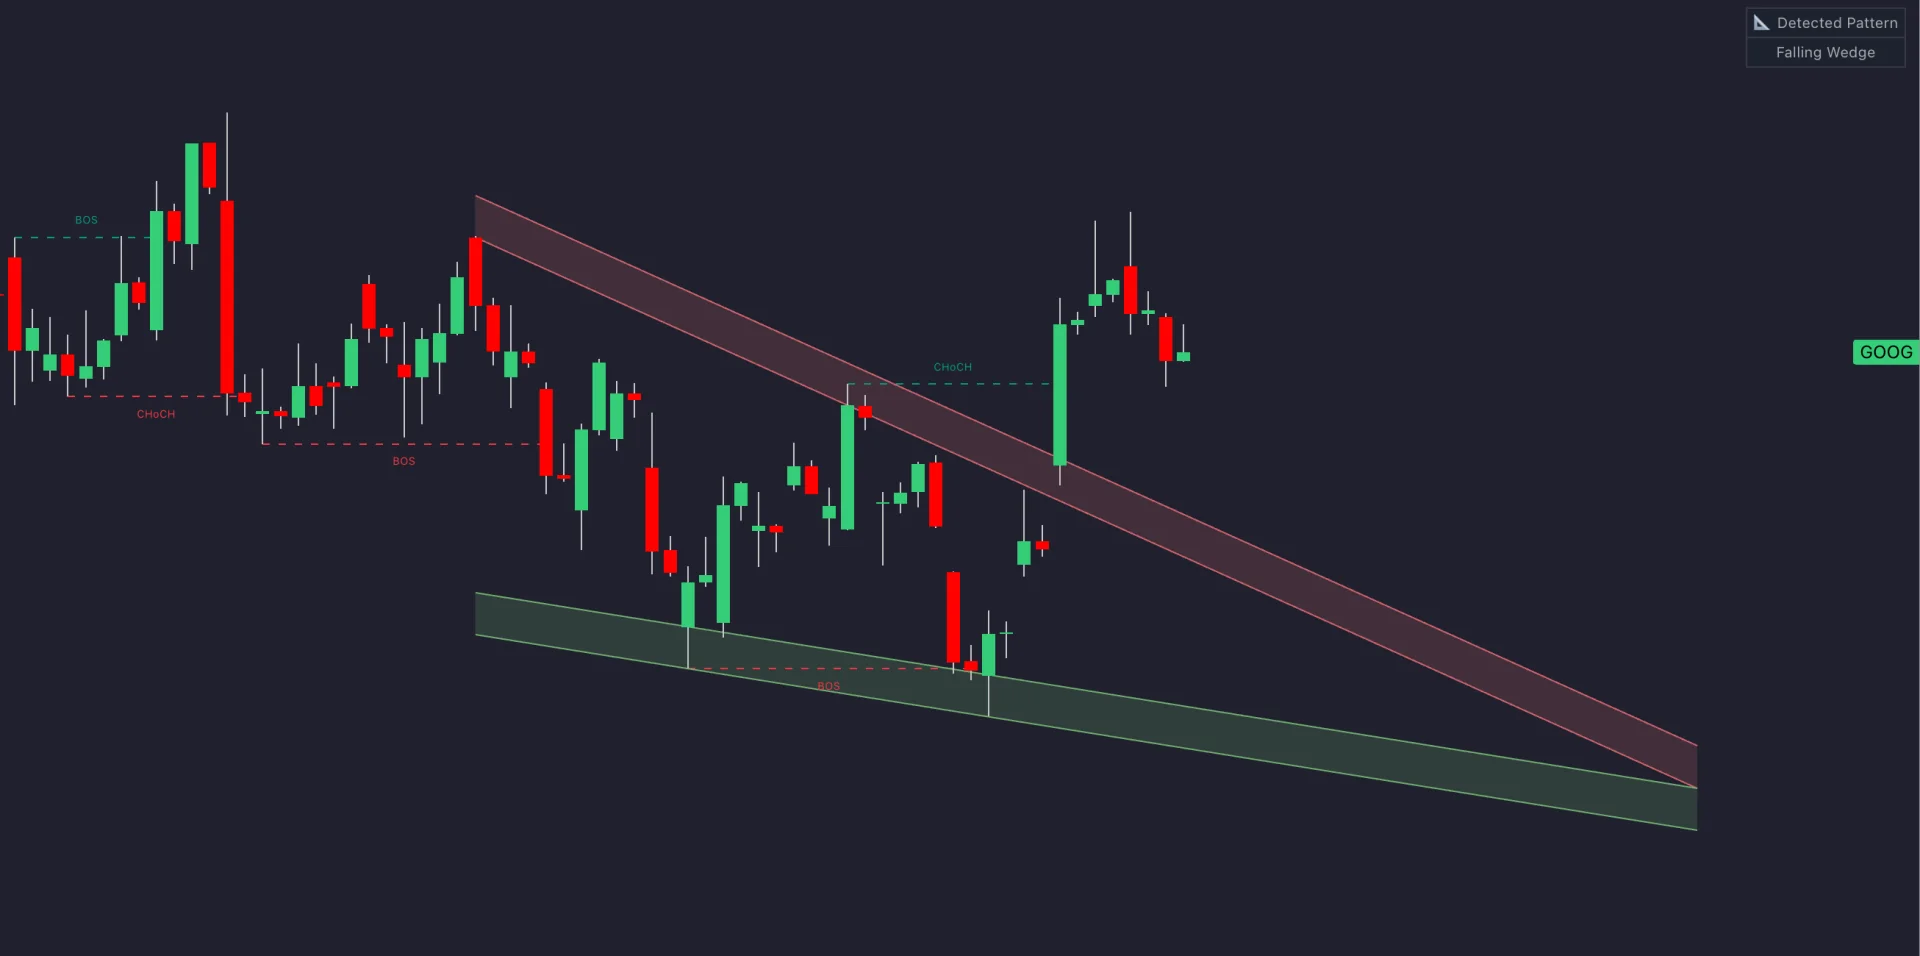
Check the documented settings for the feature and version in use. Do not assume that every wedge detector requires the same touch count, volume threshold or duration. Market-structure labels such as BOS and CHoCH add a different view of the swings; they are not interchangeable with the wedge’s boundary break.
Momentum Tools
Momentum and money-flow tools from the Library add divergence and reversal conditions on a Quant Chart. Each has a distinct role; check its documentation before adding it to a wedge rule.
A divergence or reversal condition can be tested as an additional filter. It does not certify a wedge breakout, and an overbought or oversold reading can persist. Compare the pattern alone with the additional condition using the same data and costs.
Build and Test Rules with Quant
Ask Quant, our coding agent, to help implement a specific wedge definition, including swing confirmation, convergence, minimum touches, breakout timing and setup expiry. Add the chosen stop, target, sizing and any volume filter.
Follow Making Strategies with Quant: inspect the generated code and click Run yourself. Use the native backtest guide to review fills and summary metrics. Check that later pivots and higher-timeframe closes were not used before they were available.
Compare entry and stop variants while retaining an untouched evaluation period. Review average wins/losses, costs, drawdown and sample size. A completed test does not establish future returns or automatically execute a live trade.
Wedge Pattern Video Example
Build a Repeatable Wedge Setup
Define the geometry, identify the actionable break and calculate risk at the actual entry. Use Quant Charts to review the context and Quant to help test the rules. Keep failed formations and missed retests in the analysis so the results reflect the strategy you could actually follow.
FAQs
How can I tell whether a wedge breakout will fail?
You cannot know in advance. Define the breakout and a failure condition, such as a close back inside within a specified window, then evaluate both successful and failed cases.
Does volume confirm a wedge breakout?
Volume can provide a measurable activity filter, but a surge does not guarantee follow-through. Use a consistent feed and a defined comparison period.
Are wedges always reversal patterns?
No. A rising wedge can be a bearish continuation during a downtrend rally, and a falling wedge can be a bullish continuation during an uptrend pullback.
How many touches does a wedge need?
Specify the convention used by your method or detector. Two points define a straight boundary, while additional touches help assess it. Do not mix different minimum-touch rules within one test.
Must I wait for a retest?
No. Breakout and retest entries are different models. A retest may improve the quoted entry but may never occur or may fail.
How can LuxAlgo help evaluate wedge strategies?
Review the formation on Quant Charts and use Quant to help implement explicit rules. Inspect the code, run the test yourself and examine failures, costs and out-of-sample results.
References
LuxAlgo Resources
External Resources
Read next