Concept
Level Freshness & Decay
Level Freshness & Decay, also known as fresh vs tested, touch count, is a Support/Resistance & Levels concept. The Library holds 1 implementation, a working definition you can pull into Quant.
Top Level Freshness & Decay indicator
The top custom implementation, built on the original standard Level Freshness & Decay formula.
1 total
From studying Level Freshness & Decay to trading it: take the implementation below into Quant and backtest it instantly.
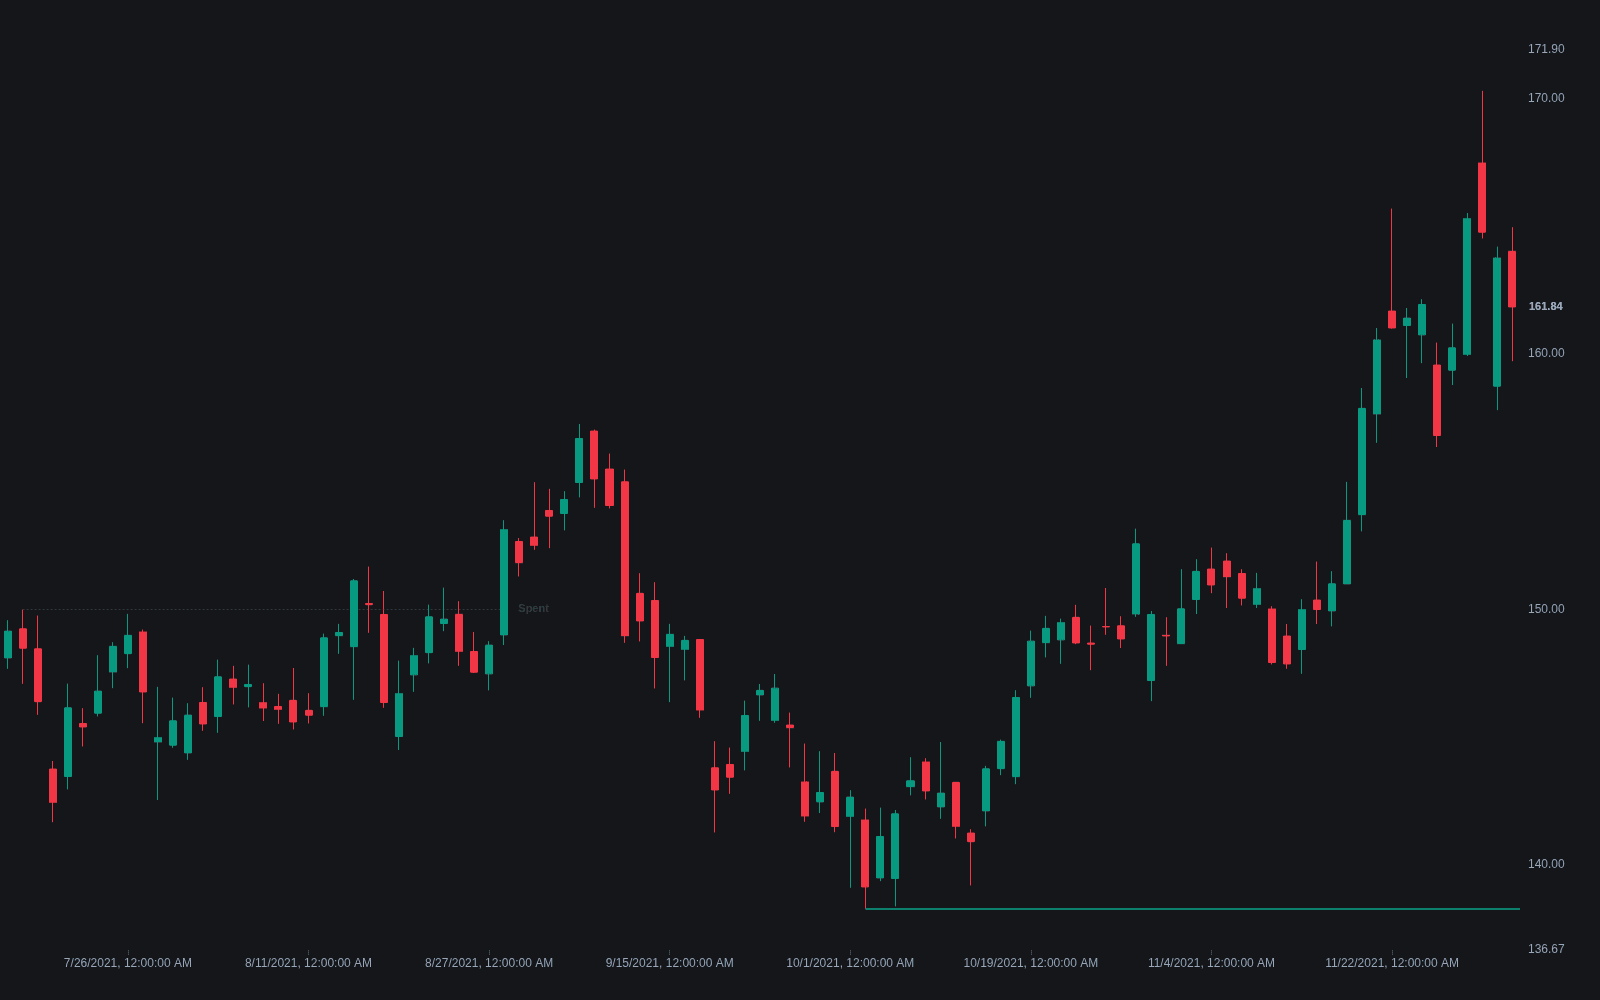
What is Level Freshness & Decay?
Level freshness and decay is the idea that a level's expected behavior changes with every interaction. A fresh support or resistance level, one that has not been revisited since it formed, still holds whatever resting interest created it. Each touch consumes part of that interest: resting orders get filled, and the participants defending the level are either satisfied or step away. Touch count is therefore a standard scoring input, and in order-flow and supply-and-demand doctrine a zero-touch level ranks highest, with the score decaying on every test.
The classical reading runs the other way, and both deserve stating. Older textbooks call a level stronger the more often it has held, because repeated defenses demonstrate participation. Order-flow reasoning counters that each defense spends ammunition, which is why a third or fourth test into a tightening market is widely read as a prelude to the breakout. In practice touch count is information to weigh, not a dial that turns one way.
Implementations turn the doctrine into bookkeeping. A tracker records each level's birth, applies a touch rule to count interactions, and decrements a score per touch, per unit of elapsed time, or both; a decisive break either deletes the level or flips its role. The smart-money vocabulary for the same idea is mitigation: a zone that price has returned to is called mitigated, meaning its resting interest is presumed spent, and scripts typically fade or gray it out. The Library's examples span the styles: ddctv's Counting Support & Resistance Levels makes the touch arithmetic explicit, NOSRAL's Session High/Low Levels with Mitigation retires session extremes once revisited, and Bostonshamrock's Carryover Levels Tracker follows which prior-session levels survive untouched into new sessions.
Two refinements keep the idea honest. First, the quality of a test carries more information than its count: a quick, shallow probe that gets rejected hard says the defenders remain, while a slow grind that penetrates deep and bounces weakly says they are being absorbed, whatever the counter reads. Second, freshness is one score among several; it combines with the level's origin and rank from level clustering algorithms and with the bounce-or-break playbook of level interaction rules. There is little formal published evidence for any specific decay schedule, so treat the exact weights as convention and calibration, not law.
How to identify level freshness and decay on a chart
Freshness tracking is bookkeeping applied to a level map, and it only means something if the rules are pinned down first.
- 1Record each level's origin: the swing, session extreme, or zone birth that created it, and mark it zero-touch from that moment.
- 2Define the touch rule explicitly, wick into the zone versus close inside it, plus a minimum bar gap so one consolidation does not count as five tests, and apply it without exceptions.
- 3Count interactions and grade them: note the depth of each penetration and the speed of the rejection, since a weak, slow bounce spends the level faster than the count implies.
- 4Apply the decay: reduce the level's score per touch and per elapsed period, and remove or flip the level on a decisive break with acceptance beyond it.
- 5Re-rank the visible map so fresh, high-scoring levels carry trade weight while heavily tested ones are watched for failure setups instead of bounces.
How traders use it
- As an entry filter: many supply-and-demand systems trade only fresh, zero-touch zones, or cut conviction after the first test and drop the level entirely after the second or third.
- As chart hygiene: automated level trackers age their lines, fading or deleting a level after a set number of touches, a time limit, or a decisive break, so the chart shows only levels that plausibly still carry standing interest.
- To anticipate the break: repeated tests with progressively weaker bounces suggest the defenders are being absorbed, shifting the plan from fading the level to trading its failure.
- For session carryover: tracking which prior period levels remain unmitigated into the new session gives an opening map of levels that still owe a reaction, the logic automated by carryover trackers.
- To size risk at zones: first touches of a fresh zone are commonly traded with tighter stops and fuller size, while tested zones demand confirmation first, so the freshness score directly modulates the entry tactic.
Level freshness vs related level concepts
Level Clustering Algorithms: Clustering builds the map; freshness and decay maintain it. One decides which prices deserve lines, the other decides how much each line still deserves trust as touches and time accumulate. Serious level engines run both stages.
Level Interaction Rules: Interaction rules are the playbook at the level: what counts as a bounce, a break, a retest. Freshness is a prior that weights the playbook, raising expectations at untouched levels and lowering them at spent ones.
Supply & Demand Zones: Zone doctrine is where the zero-touch preference originates: an unmitigated zone is held to contain unfilled institutional interest. Freshness and decay generalize that reasoning to every level type, from swing levels to session extremes and formula pivots.
Concept family
Support/Resistance & Levels
38 concepts mapped · 38 in the Library
Level Freshness & Decay FAQ
Turn Level Freshness & Decay into a trading strategy.
Take the implementation from this page into Quant, then build on it, backtest it on real data, and keep refining it in conversation.