Concept
Gaussian Process Regression
Gaussian Process Regression, also known as GPR, is a Machine Learning concept. The Library holds 2 implementations, each one a working definition you can pull into Quant.
Top Gaussian Process Regression indicators
The top custom implementations, built on the original standard Gaussian Process Regression formula.
2 total
Every Gaussian Process Regression implementation here is strategy-ready: open one in Quant, set your rules, and it backtests automatically.
What is Gaussian Process Regression?
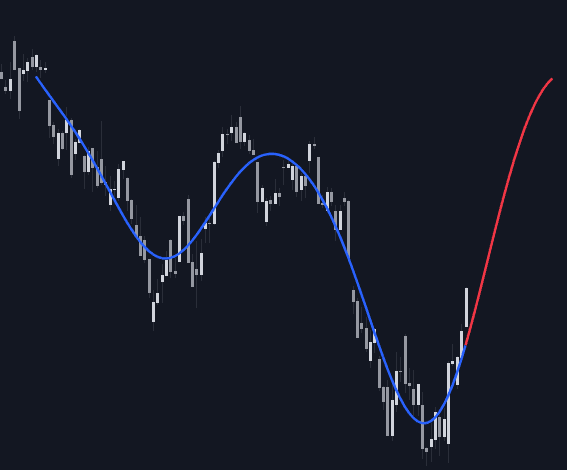
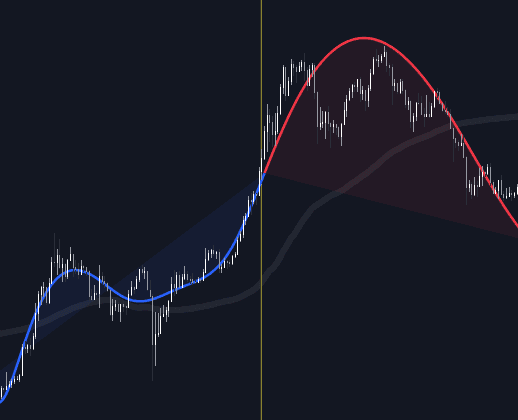
Gaussian process regression (GPR) is a Bayesian, nonparametric way to fit a smooth curve through data. A Gaussian process treats the unknown curve as a random function: any finite set of its values is jointly Gaussian, fully described by a mean function and a covariance kernel that encodes how strongly nearby points move together. Conditioning that prior on observed prices yields a posterior whose mean is the fitted curve and whose variance gives an uncertainty band at every bar, so the method outputs both an estimate and how unsure it is.
The mathematics predates machine learning by decades. Mining engineer Danie Krige used the approach in the 1950s to estimate ore grades between drill samples, and Georges Matheron formalized it in the 1960s as kriging, still the standard name in geostatistics. Rasmussen and Williams' 2006 book Gaussian Processes for Machine Learning brought the method to the wider modeling world; charting tools now apply the same posterior-mean-plus-variance construction to price windows.
On charts, GPR is fitted to a recent window of price to draw a smooth path with confidence envelopes, sometimes extended a few bars forward. The kernel's length-scale hyperparameter controls smoothness, and a noise term controls how tightly the curve hugs the data. Beyond the observed window, with the stationary kernels commonly used, the posterior mean relaxes toward the prior and the bands widen quickly, which is the model's own admission that forward projections are scenarios, not forecasts. It differs from kernel regression chiefly by producing that uncertainty estimate.
Two practical properties shape chart use. Exact GPR inverts a matrix that grows with the window, so computing cost rises roughly with the cube of the bar count and implementations keep training windows modest. Because the fit refreshes as new bars arrive, the curve over past bars can change after the fact; treat the drawn history as an in-sample fit, not a track record. The payoff is honest uncertainty, something point-output models such as neural networks do not provide without extra machinery.
How to identify Gaussian process regression on a chart
GPR appears as an overlay: a smooth fitted curve through a recent price window, usually wrapped in probability bands and often extended a few bars past the last candle.
- 1Add a GPR indicator such as LuxAlgo's Machine Learning: Gaussian Process Regression, or the anchored variant that fits from a chosen starting bar.
- 2Locate the training window or anchor: the curve is fitted only to those bars, and everything drawn beyond the last observation is extrapolation.
- 3Find the length-scale and noise settings: a longer length-scale flattens the curve toward a broad trend line, a shorter one chases wiggles, and more assumed noise loosens the curve's grip on closes.
- 4Read the bands where the tool draws them: tight across the fitted window, flaring quickly beyond the last bar, the visual signature that separates GPR from fixed-width envelopes.
- 5Test for repainting by stepping the chart forward: if the historical curve shifts as new bars arrive, the tool refits every bar, normal for GPR but important when judging past signals.
How it's calculated
A Bayesian regression that treats the series as a draw from a distribution over smooth functions and outputs a posterior mean curve with a variance band.
Kernel choice and hyperparameters (σ_f, l, σ_n) control the fit; they are either user inputs or set by maximizing the log marginal likelihood.
The exact solution needs an n × n matrix inverse costing O(n^3), so indicator implementations keep the training window short.
Beyond the last bar the posterior mean extrapolates the fitted structure and σ_*^2 widens quickly, so the projected segment is an estimate, not a price forecast.
How traders use it
- As an adaptive smoother: the posterior mean acts as a flexible fitted line through recent price, an alternative to polynomial fits that does not force a fixed curve shape.
- As uncertainty bands: price pressing the outer posterior band flags a statistically stretched move relative to the fitted curve, similar in spirit to regression-channel readings.
- As a short-horizon projection: the curve is extended forward with widening bands and read as a scenario envelope rather than a point prediction.
- As a stretch score: the gap between price and the posterior mean, divided by the posterior standard deviation, standardizes how stretched the move is; fading extreme readings is a common mean-reversion framing inside ranges.
- As a scenario tool alongside analog methods: the projected envelope pairs naturally with kNN analog forecasting, one extrapolating a fitted function and the other replaying similar historical windows; disagreement between the two is informative.
- As a pipeline component: the smoothed curve or its residuals become inputs via feature engineering, with evaluation pinned to an explicit label definition and prediction horizon so smoothing does not quietly leak future information.
GPR vs adjacent modeling approaches
Kernel Regression: Kernel regression returns a locally weighted average, a point estimate with no error bars; GPR returns a full posterior with variance at every bar, its kernel defining covariance rather than averaging weights.
Gaussian Mixture Models: The shared Gaussian name misleads: a mixture model describes how observations are distributed and sorts them into regimes, while GPR fits a curve through data as a function of time.
Neural Networks: Networks fit flexible parametric functions and scale to large datasets, but output point predictions and need substantial data. GPR is nonparametric and data-efficient on small windows, with uncertainty built in, though its cost grows steeply with window size.
Concept family
Machine Learning
32 concepts mapped · 32 in the Library
Gaussian Process Regression FAQ
Turn Gaussian Process Regression into a trading strategy.
Take any implementation from this page into Quant, then build on it, backtest it on real data, and keep refining it in conversation.