Concept
Matrix Profile
Matrix Profile, also known as motif discovery, is a Machine Learning concept. The Library holds 1 implementation, a working definition you can pull into Quant.
Top Matrix Profile indicator
The top custom implementation, built on the original standard Matrix Profile formula.
1 total
This Matrix Profile implementation is strategy-ready: open it in Quant, set your rules, and it backtests automatically.
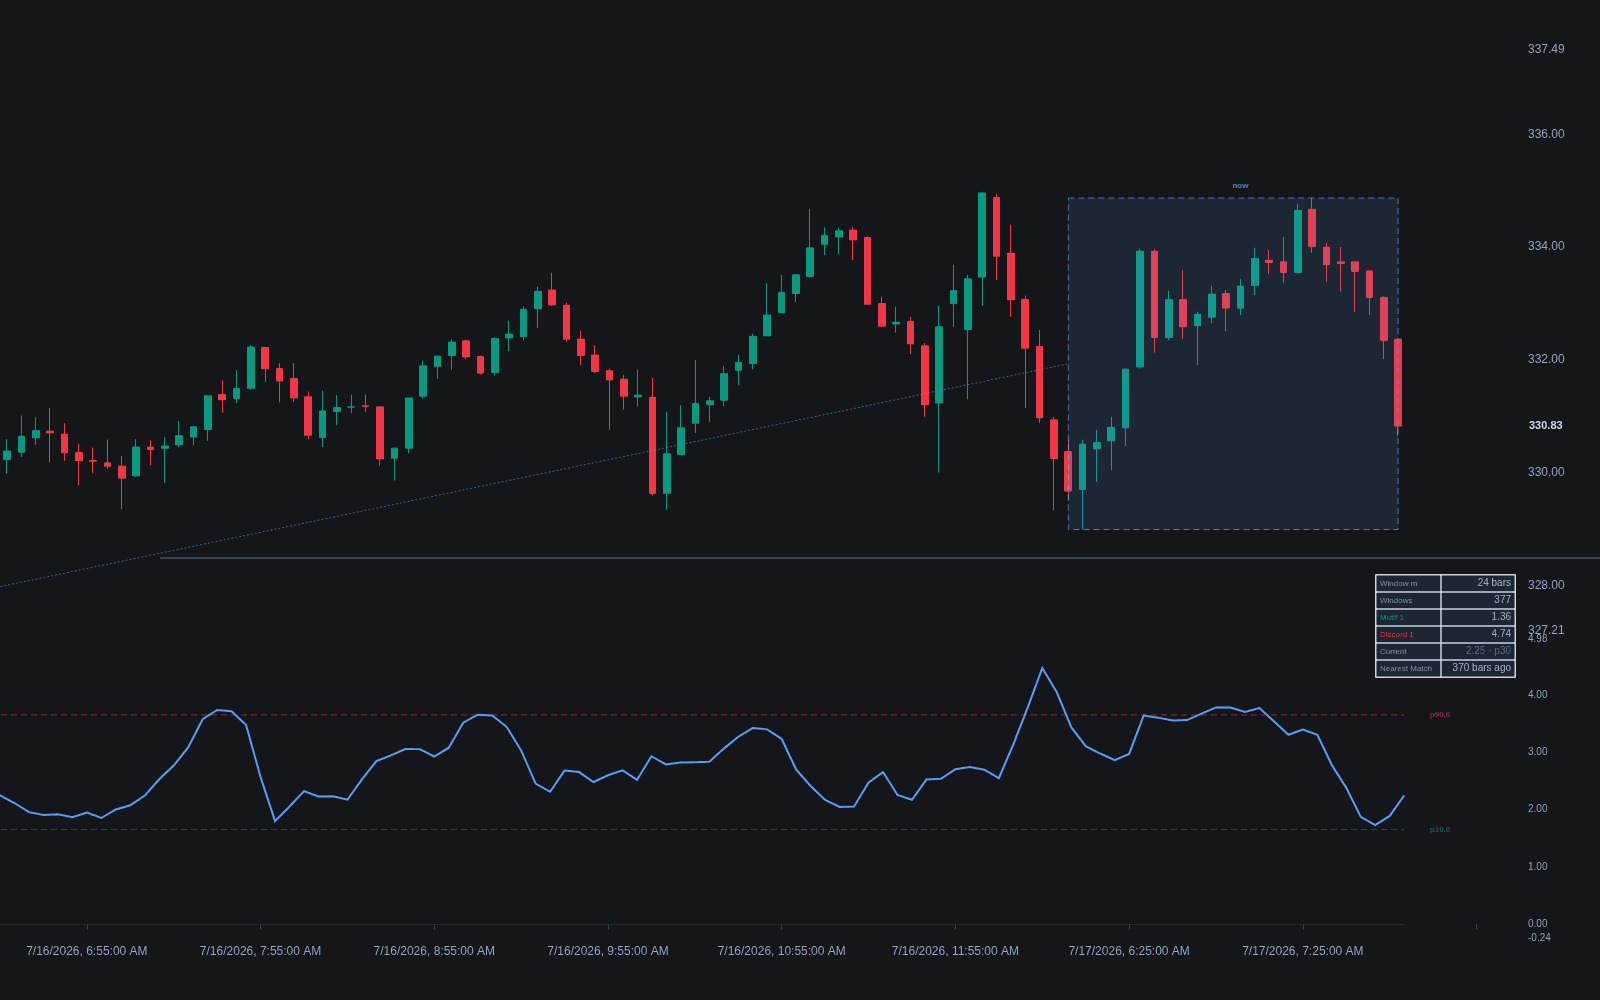
What is a Matrix Profile?
The matrix profile is a data structure for time series that stores, for every subsequence of a chosen length, the distance to its nearest neighbor elsewhere in the same series (or in a second series). It was introduced by researchers at the University of California, Riverside in 2016, together with fast algorithms that made the all-pairs comparison practical on long series. The result is a companion series aligned with the original chart: low values mark stretches whose shape has occurred before, high values mark stretches unlike anything else in the data.
That single structure answers two questions traders otherwise attack separately. The lowest points of the profile locate motifs, which is why the approach is also known as motif discovery: repeated shapes such as a recurring intraday rhythm or a habitual pullback signature. The highest points locate discords, subsequences with no good match anywhere, which function as shape-based anomalies in the spirit of outlier detection.
Distances are typically z-normalized Euclidean, so matches are judged by shape rather than by price level or volatility scale. The honest caveat is that markets contain enormous amounts of near-repetition by chance; a motif is evidence that a shape recurred, not that it predicts anything. Any claim that a discovered motif has forecasting value needs the same out-of-sample discipline as any other signal.
How it's calculated
For a series T of length n and a subsequence length m, the standard (self-join) form is:
Exact algorithms in the STOMP family compute the full profile in roughly O(n^2) with very small constants; anytime variants give usable approximations early.
Minima of MP mark motifs; maxima mark discords. A join between two different series finds shapes shared across instruments.
How traders use it
- Motif discovery: scanning an instrument for repeated intraday or swing shapes, then studying whether anything exploitable follows them. The profile finds the repeats; the trader still has to prove the edge.
- Anomaly flagging: discords highlight windows whose shape has no precedent in the sample, which can surface regime breaks, data errors, or unusual event reactions worth manual review.
- Regime and segmentation work: derived measures on the profile can suggest boundaries where the series' behavior changes, complementing formal change-point detection.
- As a fast pre-filter for analog research: instead of comparing the current window against all of history directly, the profile identifies candidate matches that finer tools such as dynamic time warping similarity can then re-rank.
- With parameter humility: results depend heavily on the window length m, and there is no canonical choice for markets. Practitioners typically compute profiles at several lengths.
Matrix Profile vs Related Concepts
Dynamic time warping similarity: DTW is a flexible distance between two sequences; the matrix profile is an exhaustive nearest-neighbor index over all subsequences, almost always built on z-normalized Euclidean distance for speed. They solve adjacent problems at different scales.
KNN analog forecasting: KNN forecasting retrieves neighbors of the current window to predict what comes next. The matrix profile is a general similarity map of the whole series; it can feed a KNN system but is not itself a forecaster.
Change-point detection: Change-point methods test for shifts in statistical properties such as mean or variance. The matrix profile works on raw shape similarity and flags novelty via discords, without a probabilistic model.
Concept family
Machine Learning
32 concepts mapped · 32 in the Library
Matrix Profile FAQ
Turn Matrix Profile into a trading strategy.
Take the implementation from this page into Quant, then build on it, backtest it on real data, and keep refining it in conversation.