Concept
Kernel Regression
Kernel Regression, also known as Nadaraya-Watson estimator, is a Machine Learning concept. The Library holds 4 implementations, each one a working definition you can pull into Quant.
Top Kernel Regression indicators
The top custom implementations, built on the original standard Kernel Regression formula.
4 total
Every Kernel Regression implementation here is strategy-ready: open one in Quant, set your rules, and it backtests automatically.
.png&w=3840&q=75)
.png&w=3840&q=75)
What is Kernel Regression?
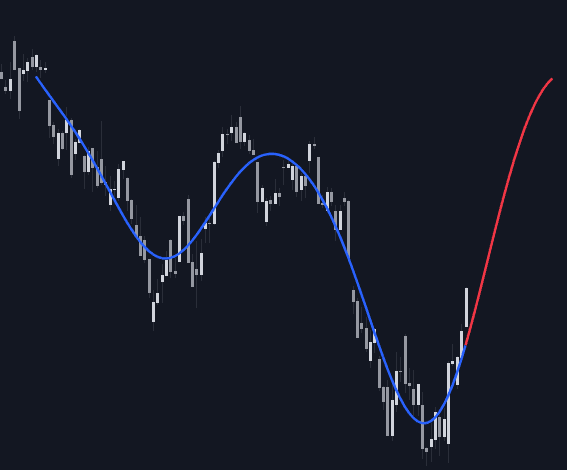
Kernel regression is a nonparametric way to draw a smooth curve through noisy data. Instead of assuming a functional form, it estimates the value at each point as a weighted average of nearby observations, with weights supplied by a kernel: a function that is largest at zero distance and decays as observations sit farther away. The classic form is the Nadaraya-Watson estimator, which divides the kernel-weighted sum of observed values by the sum of the kernel weights. On charts the distance is measured in bars, the kernel is commonly Gaussian or rational quadratic, and a bandwidth parameter sets how fast weight decays: small bandwidth hugs price, large bandwidth smooths and flattens.
Traders read the fitted curve as an estimate of the underlying path of price, often wrapped in an envelope built by adding and subtracting a multiple of a deviation measure such as the mean absolute error of the fit. The decisive implementation detail is causality. The textbook estimator is two-sided: each point is estimated using bars on both sides, so every new bar re-weights the window and redraws recent history, making the historical line look far better than anything achievable live. One-sided variants weight only past bars; they do not repaint, and they behave like a weighted moving average with kernel-shaped weights, at the cost of lag.
How to calculate the Nadaraya-Watson estimator
At each bar where the fit is evaluated, the estimate is a normalized, kernel-weighted average of the window.
- 1Choose a kernel (Gaussian and rational quadratic are common) and a bandwidth controlling how quickly weight decays with distance in bars.
- 2For the evaluation bar, weight every bar in the window by applying the kernel to the gap between that bar's index and the evaluation index.
- 3Multiply each bar's price by its weight, sum the products, and divide by the sum of the weights; that ratio is the estimate.
- 4Repeat across the chart. Weighting bars on both sides yields the smooth two-sided fit that repaints; restricting weights to past bars yields the causal, tradable version.
How it's calculated
Kernel regression (the Nadaraya-Watson estimator) estimates a smooth curve as a locally weighted average, with weights that fall off with distance according to a kernel function.
The textbook estimator weights observations on both sides of each point, so interior values change as new bars arrive (a repainting form); the causal form uses only past bars and does not repaint.
Bandwidth h drives the result far more than the kernel choice.
Constant factors in the kernel cancel between numerator and denominator, which is why unnormalized kernels are used.
How traders use it
- As a trend estimate: the curve's slope and slope changes are read as direction and turning signals, with the caveat that two-sided fits only confirm turns at the live edge after the fact.
- As envelopes: the fit plus and minus a multiple of its typical error forms a channel, the kernel analog of an MA envelope; band touches are treated as stretched prices for mean-reversion setups.
- As a denoised input: swing detection, crossovers, or divergence checks run on the smoothed series instead of raw price to cut whipsaw, accepting the added lag.
- As a hindsight check: comparing causal and two-sided versions of the same fit shows how much of the visual quality is retrospective; repaint-safe engineering treats only the causal series as tradable.
Kernel Regression vs other smoothers
LOESS Smoothing: LOESS fits a small local polynomial (a line or parabola) inside each window, so it tracks curvature better near turns; Nadaraya-Watson fits a locally constant weighted mean. Both are typically computed two-sided.
Gaussian Process Regression: GPR is a Bayesian model in which the kernel defines a covariance structure, returning a posterior mean plus an uncertainty band; kernel regression returns a point estimate with no probabilistic error model.
Gaussian Filter: A Gaussian filter is a causal linear filter with fixed Gaussian-shaped coefficients applied to past bars only; the common charting form of kernel regression normalizes its weights over the window and looks both directions, which is why it appears smoother in hindsight.
More Kernel Regression implementations
Concept family
Machine Learning
32 concepts mapped · 32 in the Library
Kernel Regression FAQ
Turn Kernel Regression into a trading strategy.
Take any implementation from this page into Quant, then build on it, backtest it on real data, and keep refining it in conversation.