Ascending/Descending/Symmetrical Triangle
 By LuxAlgoJul 16, 2026
Ascending/Descending/Symmetrical Triangle is an indicator on Vela, our next-generation charting platform, written in Pine Script®.
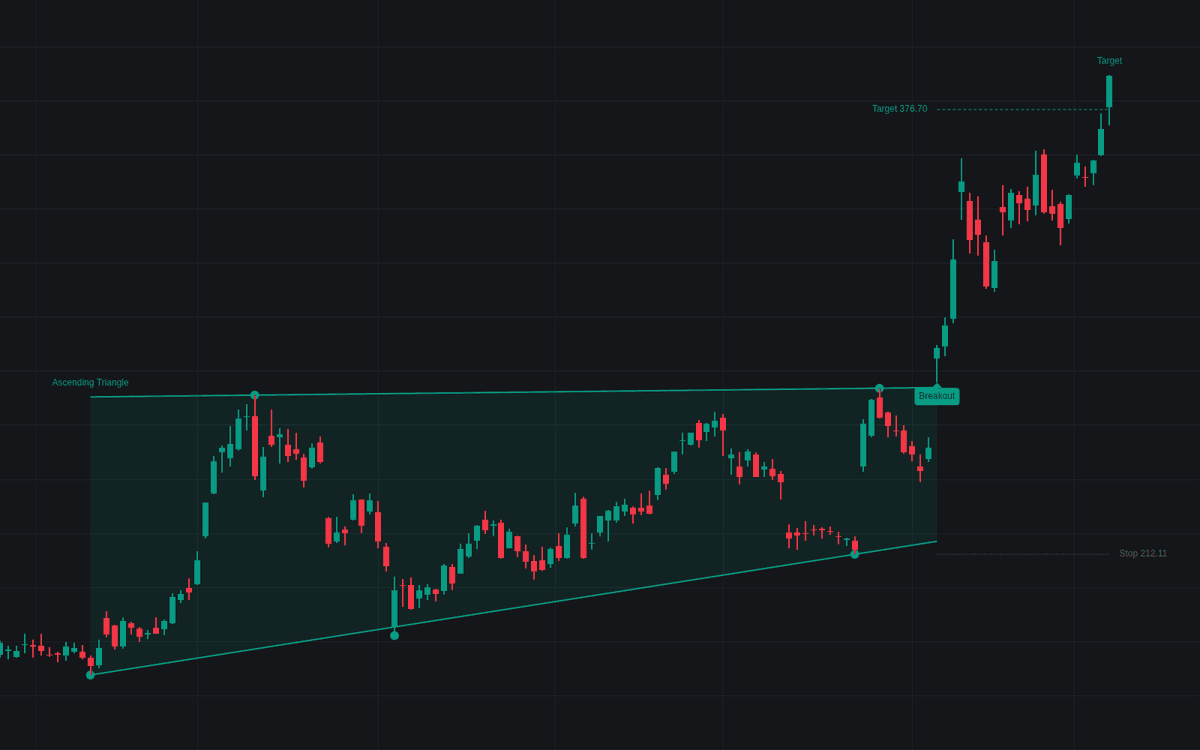

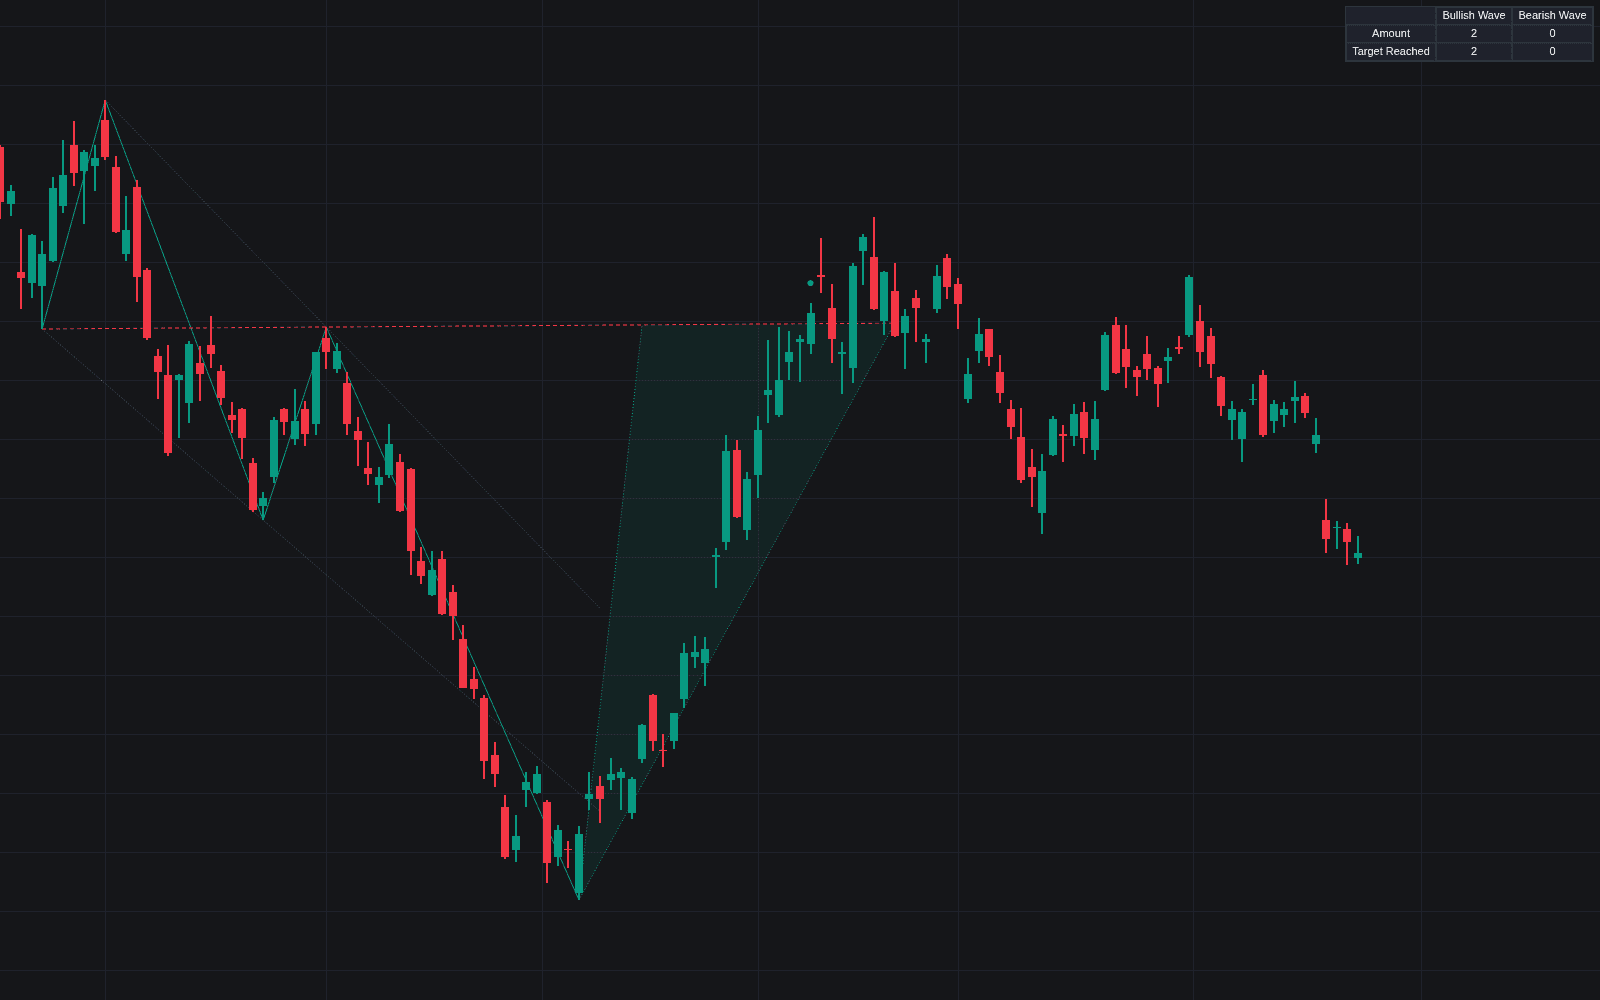
The Ascending/Descending/Symmetrical Triangle is a technical analysis indicator designed to automate the identification and visualization of classic geometric chart patterns. By detecting converging price boundaries based on confirmed swing pivots, the indicator helps traders isolate periods of market consolidation that frequently precede significant volatility. It provides clarity on market structure by highlighting triangle boundaries, measuring potential price objectives via the classical measure rule, and tracking trade performance after a breakout, offering a robust framework for identifying high-probability continuation or reversal setups.
How to Trade the Ascending/Descending/Symmetrical Triangle?
Trading with this indicator involves monitoring price action as it coils within the converging boundaries. A primary entry signal occurs when price generates a decisive close beyond the upper or lower boundary, confirming the resolution of the pattern. To increase reliability, look for volume expansion during the breakout, which confirms that market participants are backing the move. The indicator automatically plots a potential profit target based on the width of the triangle at its origin. Manage risk by placing stop-loss orders near the last swing point inside the pattern, as price acceptance back inside the boundary often signals a failed breakout or a trap. Avoid taking signals if the price has drifted too far into the apex, as the pattern's predictive power diminishes significantly as the lines converge.
Ascending/Descending/Symmetrical Triangle Settings
Triangle Detection
- Swing Length: The number of bars to the left and right a high or low must dominate to confirm a swing point.
- Maximum Swings: The maximum number of consecutive swings scanned to form a single triangle.
- Touches per Boundary: The minimum number of swing touches required on both the upper and lower lines.
- Minimum Total Touches: The aggregate number of touches across both boundaries needed for validity.
- Touch Tolerance: A volatility-based threshold (ATR) determining how close price must be to a line to register a touch.
- Flat Boundary Tolerance: The maximum percentage of drift allowed for a line to be classified as flat.
- Minimum Height: The smallest vertical distance at the start of the pattern, measured in ATR multiples.
- Minimum Length: The minimum duration in bars from the first touch to the last.
- Minimum Contraction: The required reduction in height from the first touch to the final point to ensure the pattern is shrinking.
- Apex Cutoff: The point near the convergence zone where an unresolved pattern is discarded.
- ATR Length: The period used for average true range calculations to scale sensitivity.
Breakout & Measure Rule
- Decisive Break Buffer: An additional ATR buffer required for a candle close to be considered a valid breakout.
- Require Volume Expansion: Filters breakouts based on whether volume exceeds its moving average.
- Volume Average Length: The period for the volume average used during breakout confirmation.
- Measured Target: Enables the projection of the triangle height from the breakout point as an objective.
- Closes Back Inside for Failure: Consecutive bars inside the boundary required to classify a breakout as a failure.
- Post-Break Watch: The duration in bars to monitor the target and stop levels after a breakout.
Style
- Forming Triangle: Sets the color for patterns currently in formation.
- Upside/Downside Break: Defines the colors for bullish and bearish breakouts.
- Stops & Failures: Assigns colors for stop-loss and failure labels.
- Show Boundary Touches: Toggles the visibility of specific swing points used for pattern validation.
- Pattern Fill: Toggles shading inside the triangle boundaries.
Frequently Asked Questions
Free to use
Run it on Vela. Go further with a paid plan.
- Up to 500 Custom Alerts, with webhook automation
- Up to 10× the chart history of Free
- Orderflow lookback up to full history
- More Quant usage to customize it, plus extra usage when you need it
- Futures data alongside crypto, stocks, forex and commodities

Related indicators
Run it on Vela. Make it yours with Quant.
Open this indicator free on Vela, our next-generation charting platform. Then ask Quant, our coding agent built into Vela, to retune it or turn it into a backtested strategy of your own.