Rectangle
 By LuxAlgoApr 7, 2026
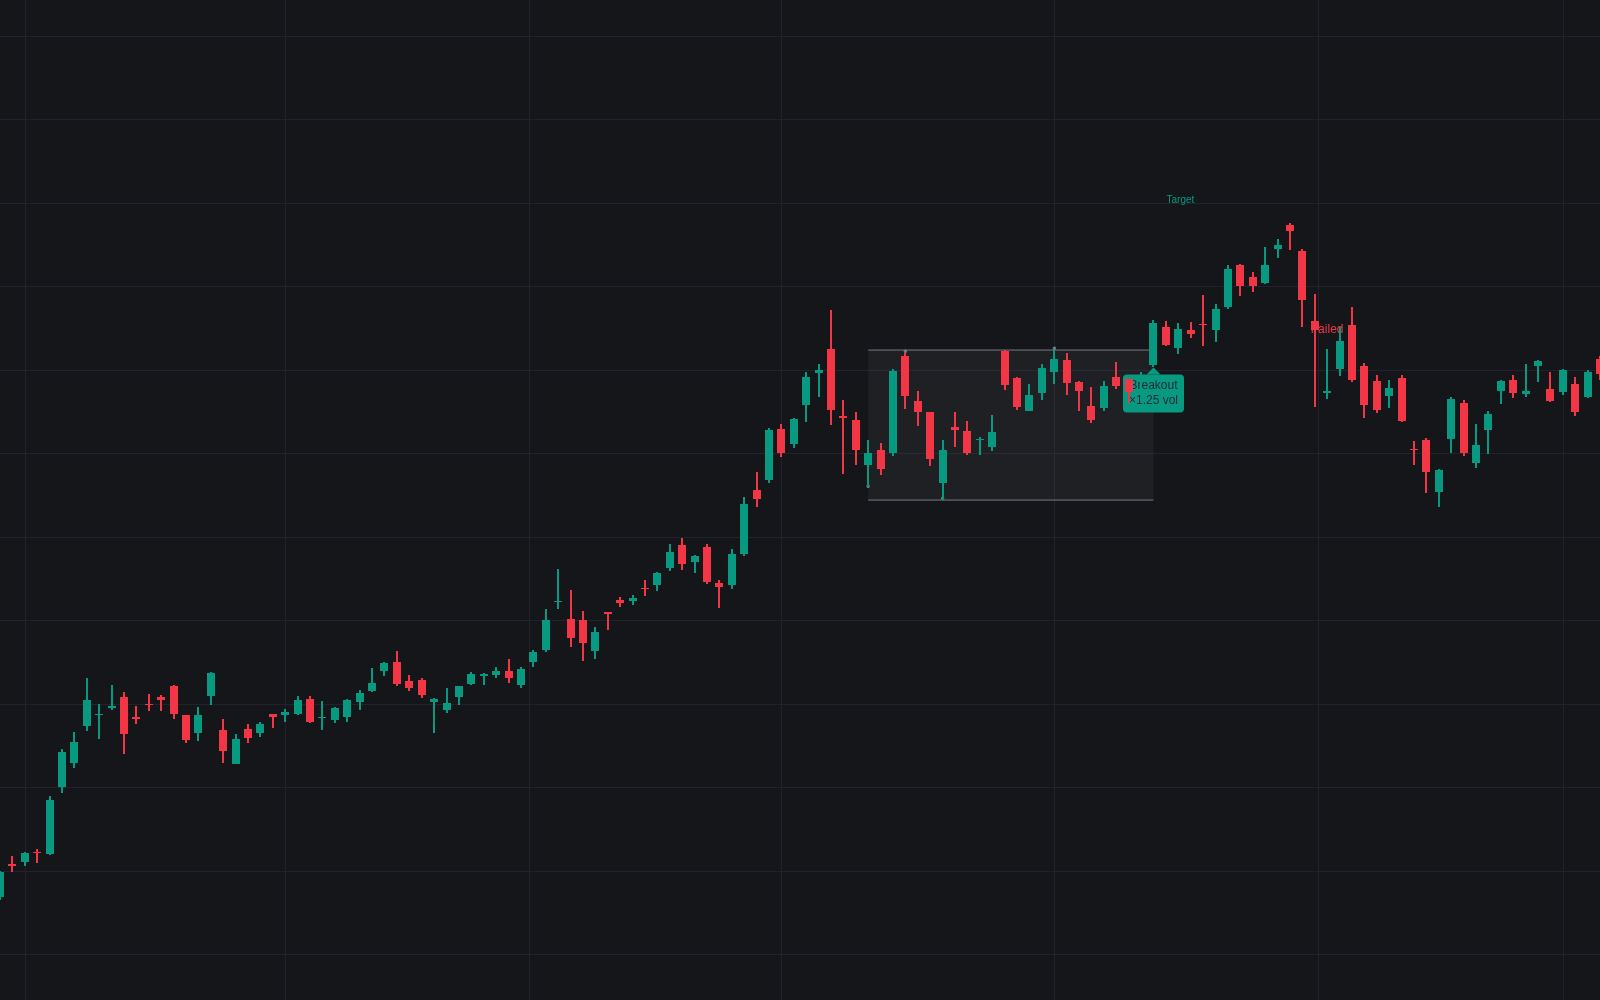

Rectangle finds the sideways box the classical way: confirmed swing highs clustering into a flat ceiling, confirmed swing lows into a flat floor, each boundary proven by at least two genuine touches within an ATR-scaled tolerance, and no decisive close beyond either side across the formation. Once confirmed, the rectangle has no expiry (the box extends until a boundary gives way), with the proving touches dotted on the chart.
How to Trade the Rectangle?
- Decisive close beyond a boundary: the breakout label prints with volume as a multiple of its recent average. A conspicuously quiet break earns suspicion.
- Measured target: the box height projected from the broken boundary (the classical minimum objective), drawn dotted until reached.
- Failed breakout: a close back inside before the objective traps one side; a cue to stand down or consider the reverse.
- Partial rise / partial decline: an incomplete rotation, the documented lean toward the opposite side breaking.
Ceiling and floor tests inside the box carry their own alerts, nine in total.
Rectangle Settings
- Swing Length (default 5): bars each side to confirm swing touches.
- Minimum Touches per Boundary (default 2): the classical proof standard.
- Boundary Tolerance (default 0.5) with Tolerance ATR Length (default 14): how far touches may spread and still count as one boundary.
- Maximum Formation Length (default 200): the bar span allowed between the first and last touch.
- Measured Target, Mark Failed Breakouts, Volume Note on Breakouts (all default enabled) with Volume Average Length (default 20).
- Partial Rises & Declines (default enabled) with Minimum Rotation % (default 50); style inputs cover colors and touch markers.
Frequently Asked Questions

Original indicatorBuilt in-house by LuxAlgo
The Library is free. Quant makes it yours.
Pull any concept or indicator into Quant: rebuild it, retune it, or turn it into a backtested strategy of your own.