Gann Method
 By LuxAlgoOct 9, 2026
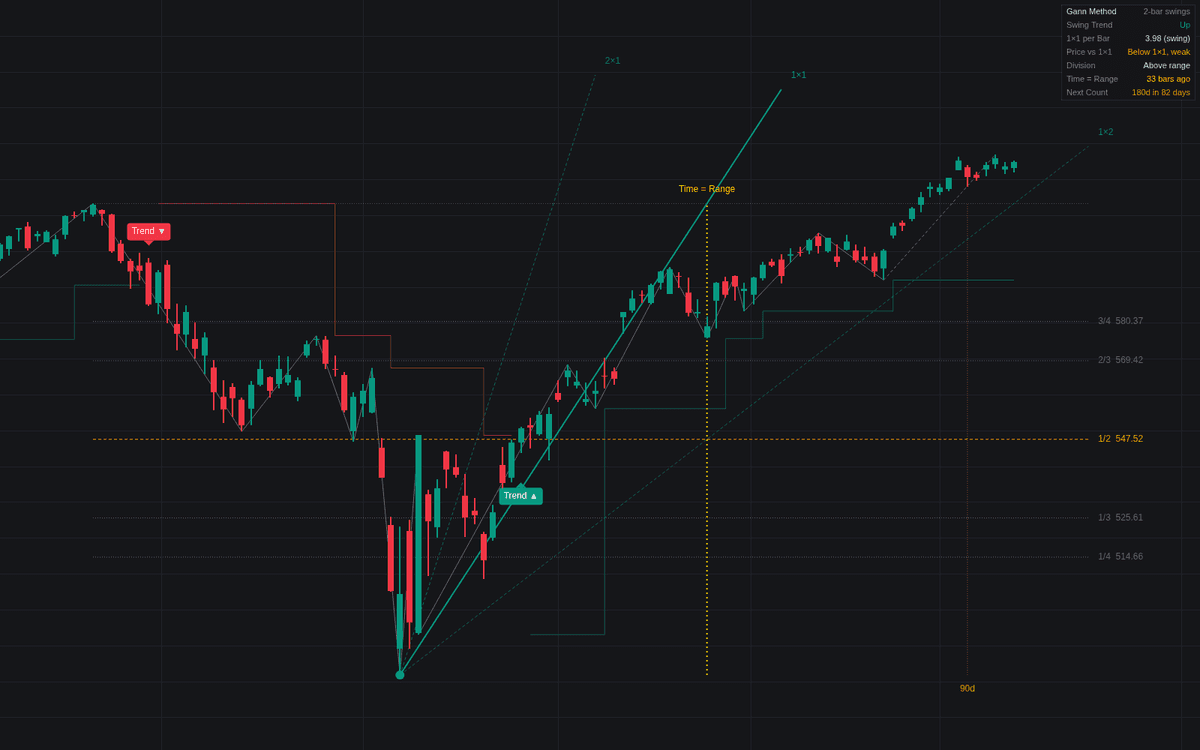

The Gann Method brings classic market analysis concepts to the modern chart, allowing traders to map price movement against mechanical swing cycles and geometric projections. By anchoring to significant market turns, this tool creates a structured framework for analyzing trends, support and resistance levels, and potential time based reversal windows. It helps identify the interaction between price and time, a core principle in Gann's philosophy, providing a systematic way to gauge whether a trend is currently strong or weakening.
How to Trade the Gann Method?
The indicator centers on identifying swing trends and projecting geometric angles from specific anchor points. To trade with the system, first observe the Swing Trend, which turns up after a close above the last swing high and down after a close below the last swing low. This trend definition dictates the bias for the current leg.
When a new trend is established, the indicator projects 1x1, 2x1, and 4x1 angles. Price holding above the 1x1 angle in an uptrend (or below in a downtrend) is often interpreted as a sign of strength. Range divisions serve as dynamic support and resistance zones, with the 50% midpoint often acting as a critical pivot point. Traders often watch for price reactions as it reaches these geometric levels or when time elapsed from the anchor matches the duration of the initial swing, known as a price time square. Use the dashboard to monitor your current distance from these key levels and the countdown to upcoming time cycles.
Gann Method Settings
Swing Chart
- Swing Chart Bars: The number of consecutive bars required to confirm a new swing pivot. Higher values produce fewer, more significant swings.
- Show Swing Line: Toggles the display of the lines connecting the confirmed swing highs and lows.
- Show Trend Changes: Displays labels and a step line that highlights the current trend direction and the stop levels defined by the last swing pivot.
Angles
- 1x1 Scale: Determines how the geometric angles are calculated. Options include anchoring to the swing's own range, using the Average True Range, or a manual price per bar input.
- ATR Length & Mult: Used for the ATR based 1x1 scaling.
- Manual Price per Bar: A user defined value for the slope of the 1x1 angle.
- 2x1 & 1x2 / 4x1 & 1x4: Toggles the secondary fan lines representing different price to time ratios.
Range Divisions
- Divisions: Choose between key fractions, eighths, or both to display as horizontal support and resistance levels.
- Show Divisions: Enables the drawing of these fractional levels across the chart.
Time
- Show Price-Time Square: Highlights the point where the time elapsed since the anchor equals the duration of the anchor swing.
- Calendar Day Counts: Comma separated values representing specific day counts from the anchor to watch for potential turns.
Dashboard
- Show Dashboard / Position / Size: Configures the floating panel that displays current trend status, price relative to the 1x1 angle, and time projections.
Frequently Asked Questions
Free on Vela
Run it on Vela. Go further with a paid plan.
- Up to 500 strategy alerts, with webhook automation
- Up to 10× the chart history of Free
- Orderflow lookback up to full history
- Up to 100,000 monthly credits for Quant to customize it
- Futures data alongside crypto, stocks, forex and commodities

Run it on Vela. Make it yours with Quant.
Open this indicator free on Vela, our next-generation charting platform. Then ask Quant, our coding agent built into Vela, to retune it or turn it into a backtested strategy of your own.