Gann Method
Gann Method, also known as Gann theory, Gann analysis, W.D. Gann theory, Gann trading, is a Trend concept. The Library holds 3 implementations, each one a working definition you can pull into Quant.
Top Gann Method indicators
The top custom implementations, built on the original standard Gann Method formula.
3 total
Any of the 3 Gann Method implementations below can become a backtested trading strategy — describe your rules and Quant writes the code.
What is Gann Theory?
Gann theory is the collective name for the price-and-time methods of W.D. Gann (1878-1955), from fixed-rate angles and range divisions to number squares, swing charts and time cycles, built on the premise that price and time are proportional. Gann, a Texas cotton broker turned New York trader, published market books and sold private courses from the 1920s through the 1950s. His organizing idea was that markets move at measurable rates and that important turns tend to come where a price relationship and a time relationship coincide, which he called squaring price with time. He never published one unified system under this name; the label covers a toolkit later traders assembled from his books and courses.
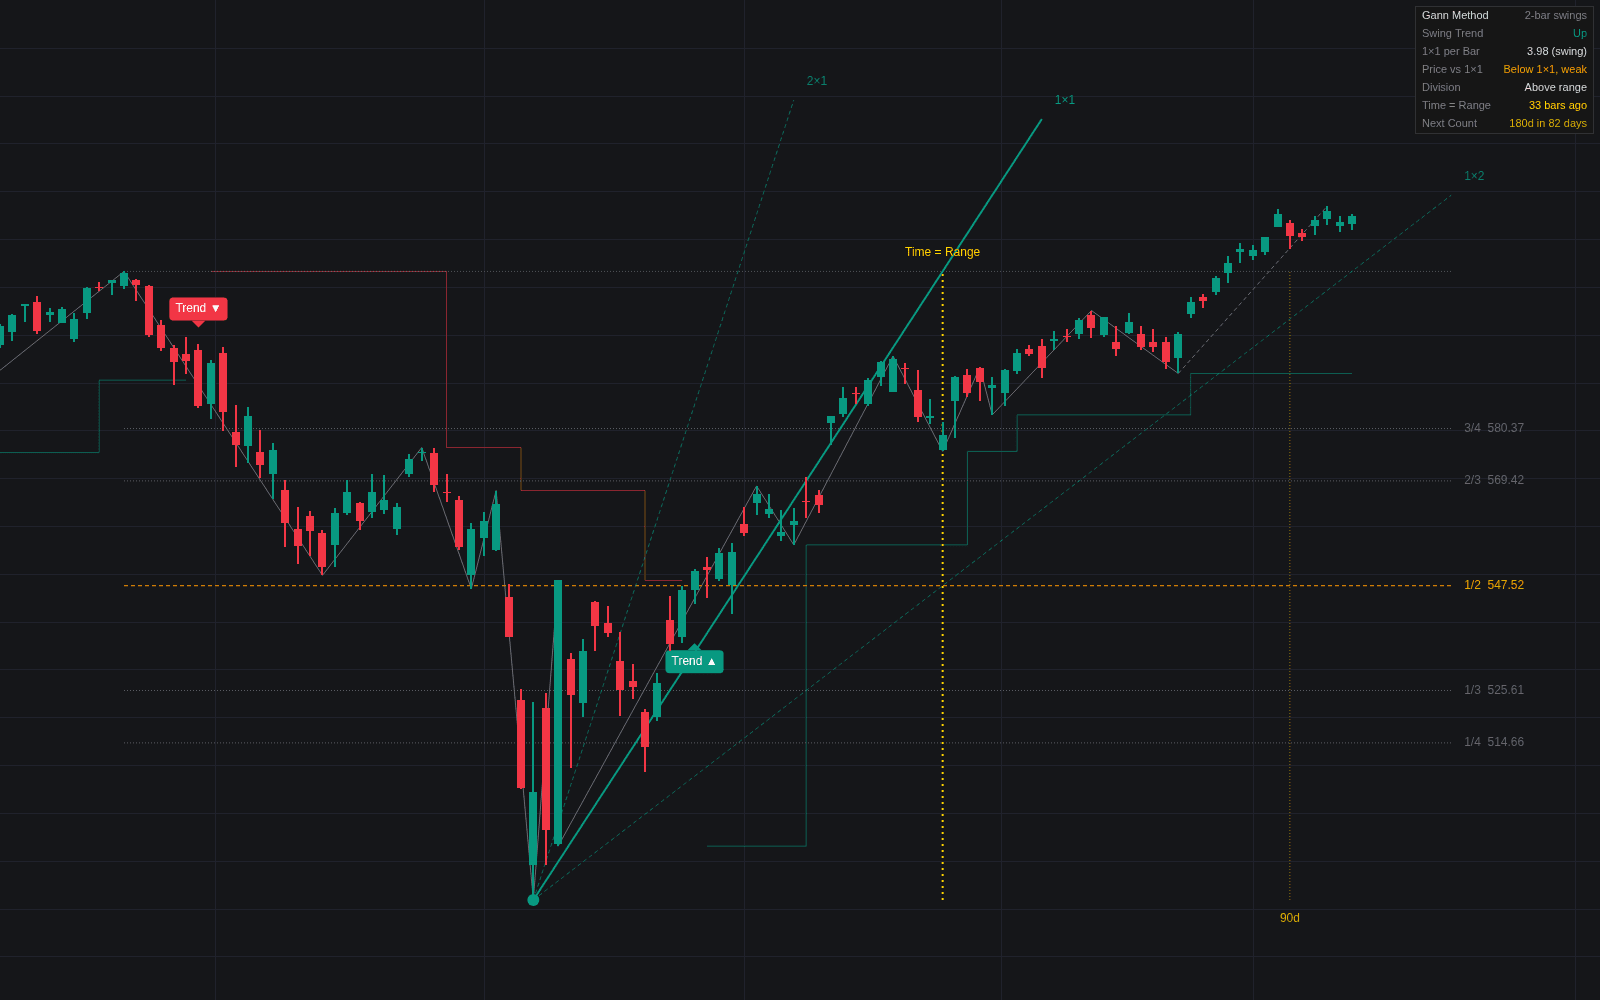
The books are the verifiable core. Truth of the Stock Tape (1923), Wall Street Stock Selector (1930), New Stock Trend Detector (1936), How to Make Profits in Commodities (1941) and 45 Years in Wall Street (1949) set out trend rules, swing charts (his trend line indicator), resistance levels from dividing a price range into eighths and thirds with special weight on the 50% point, time cycles and anniversary dates, and money management, including the twenty-four rules of 45 Years in Wall Street that insist on stop-loss orders and on never risking more than a tenth of capital on one trade. The geometric devices most associated with his name, the Square of 9 and his other master charts, come mainly from course material that is cryptic and has been reconstructed by later authors in conflicting ways.
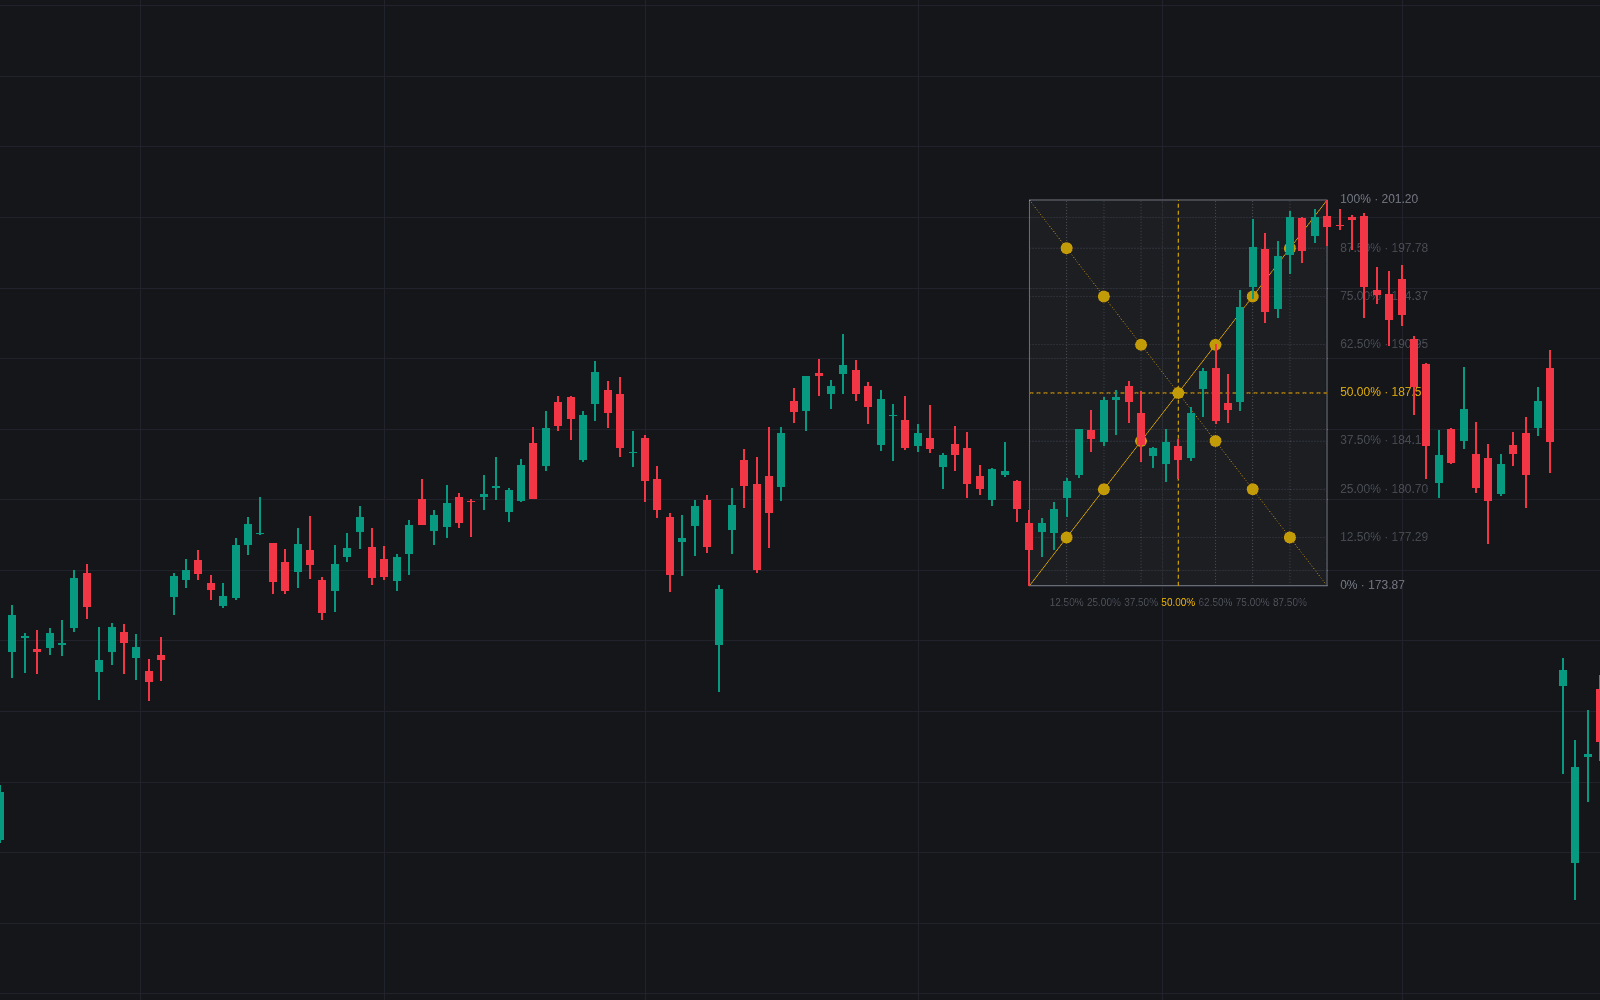
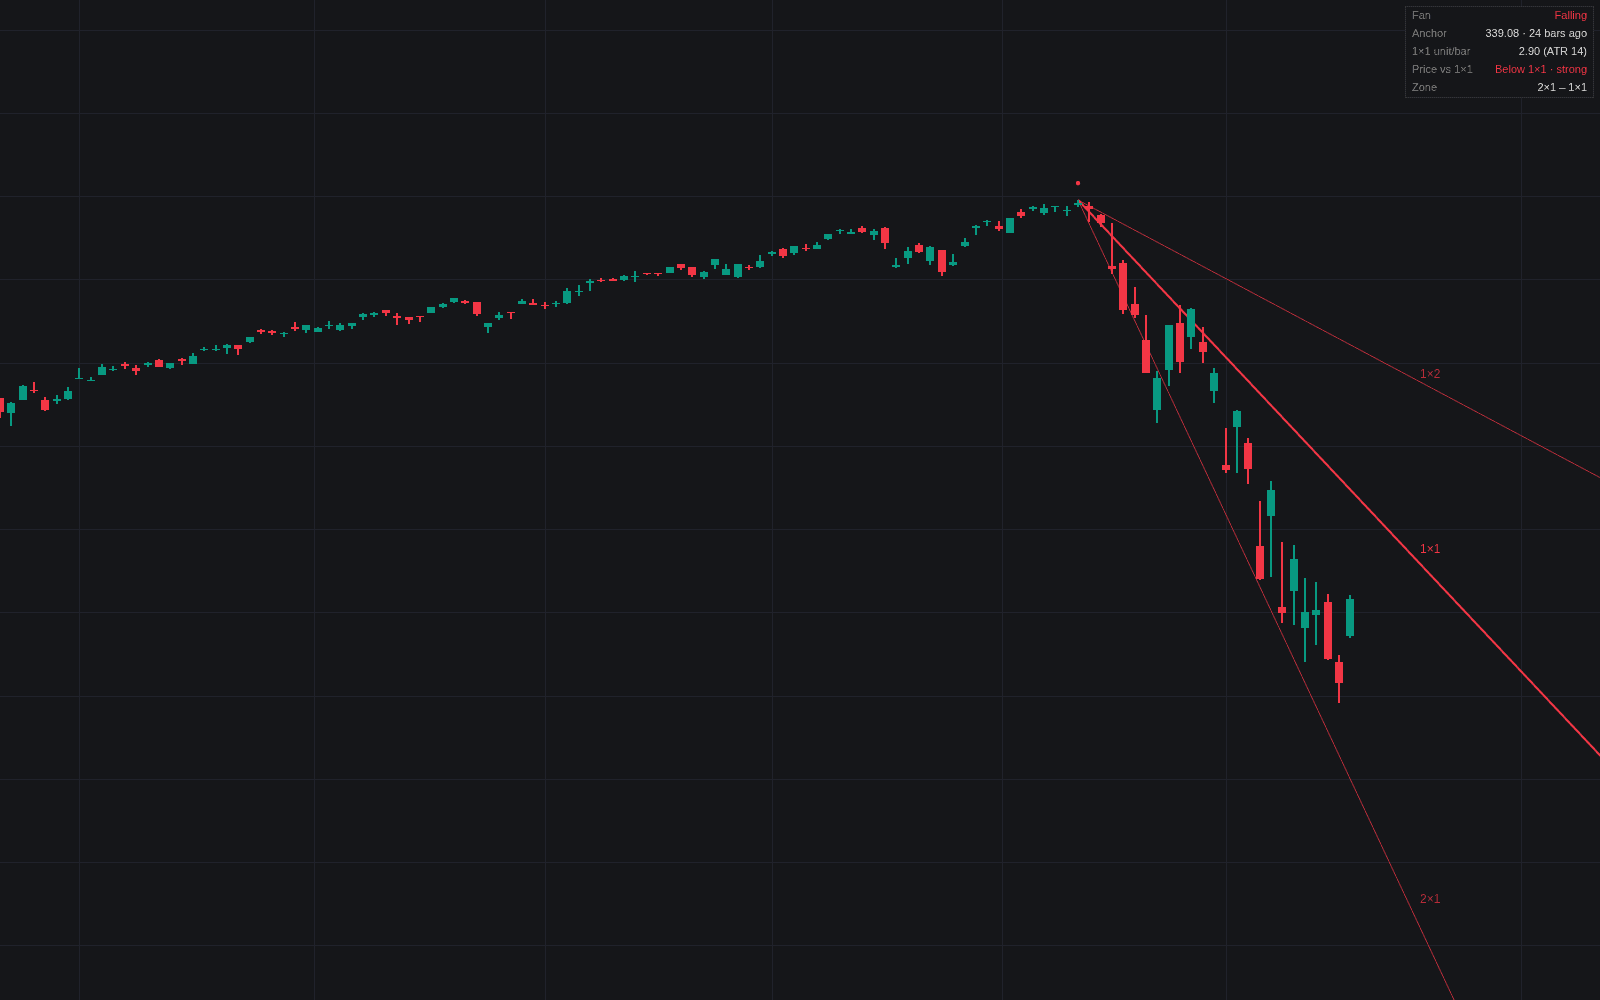
On a modern chart the toolkit separates into parts, each with its own page. Gann fans and angles draw lines at fixed price-per-time rates from a pivot, led by the 1×1. The Gann box grids a swing into price and time fractions. The Square of 9 is a number spiral that turns one anchor price into a ladder of support and resistance levels. Gann time cycles and anniversaries project candidate turn dates from past highs and lows. One tool that carries his name is not his: the Gann HiLo Activator was introduced by Robert Krausz in the 1990s.
The reputation outruns the record. A December 1909 article in Richard Wyckoff's The Ticker and Investment Digest reported that Gann made 286 trades that October, 264 of them profitable, under an observer's watch; the account was never independently audited. Alexander Elder later reported that Gann's son said his father supported the family by selling courses rather than by trading, and a private letter to a student shows Gann using planetary cycles to forecast coffee prices, tying part of his work to astro cycles. No rigorous study shows his methods predict markets, and because they generate many levels and dates, hits are easy to find after the fact. They are best read as a structured way to produce candidate prices and times that still need confirmation from price.
How Gann analysis is applied to a chart
Practitioners combine the parts roughly in this order, working from the largest swings down:
- 1Choose anchors: the major highs and lows on weekly or monthly charts, since Gann worked from significant turns and minor swings multiply false levels.
- 2Divide the range: mark eighths and thirds of the move between anchors, the 50% point first, the same grid a Gann box draws.
- 3Project angles: draw the 1×1 and its neighbors from each anchor at a fixed, stated price-per-bar scale, and note which angle currently contains price.
- 4Project time: mark anniversaries of the anchors and counts such as 90, 180 and 360 days from them.
- 5Look for squaring: a price level and a time projection arriving together is the setup the method is built around.
- 6Let price decide: act only when a swing or reversal bar confirms at the level, with a stop beyond it, as Gann's own rules required.
How traders use it
- Confluence mapping: Gann levels usually serve as one layer among several, with a 50% point or an eighth division gaining weight where it meets a prior swing, a Fib retracement level or a round number.
- Trend speed: whether price holds above or below the 1×1 angle from a major low is read as a measure of trend strength, and breaks toward shallower angles as deceleration.
- Turn windows: anniversary dates and time counts flag sessions to watch for reversal behavior, not dates to trade blind.
- Risk discipline: even traders who discard the geometry cite Gann's rules on stops and position size, the least controversial part of his work.
- On LuxAlgo charts: the Gann Box, Gann Fan & Angles (its 1×1 defined in price per bar from ATR at the anchor) and Gann Square of 9 Vibration Levels each implement one part of the toolkit with explicit, reproducible settings.
Gann Theory vs related concepts
Gann Fan & Angles: One component: lines at fixed price-per-time rates from a single pivot. Gann theory is the framework that combines angles with range divisions, number squares, swing charts and time cycles.
Gann Square of 9: The best known of Gann's numeric devices, a spiral that converts one price into a ladder of related levels. It comes from course material rather than his books, which makes it the most reconstructed part of the method.
Gann HiLo Activator: Shares the name only: a trailing line built from short averages of highs and lows, introduced by Robert Krausz in the 1990s, not something Gann published.
Elliott Wave Theory: The other classic search for hidden order in markets. Elliott counts waves shaped by crowd psychology; Gann measures fixed proportions of price and time. Both fit history easily after the fact, and neither has rigorous evidence of predictive power.
Concept family
Trend
104 concepts mapped · 104 in the Library
Gann Method FAQ
Turn Gann Method into a trading strategy.
Take any implementation from this page into Quant, then build on it, backtest it on real data, and keep refining it in conversation.